
Analytics for Spire user guide
Updated November 8, 2026
Version 3.9.1 | November 2026 By Gemini Logic Inc.
1. Introduction
Analytics for Spire is a reporting and analytics tool built for users of the Spire ERP system. It allows you to:
- Build reports by picking tables and columns from your Spire database — no SQL required.
- Create pivot tables to summarize and cross-tabulate your data.
- Generate professional financial reports like Trial Balance, Balance Sheet, Profit & Loss, AR/AP Aging, and Cash Flow.
- Visualize data with bar, line, pie, and area charts.
- Ask the AI Assistant to build reports for you using plain English.
- Switch between multiple companies if you have several Spire databases.
- Export to Excel or CSV with professional formatting.
- Save and reuse report configurations as templates.
- Schedule automated email reports to deliver Excel files on a recurring basis — or send them only when something needs attention (alert emails).
- Email customer statements automatically, with aging buckets and your company logo.
- Report across several companies at once when you run more than one Spire database.
- Publish live dashboards to office TVs and shared screens.
- Control who sees what with Viewer / Analyst / Admin roles, per-user feature permissions, and per-company access.
This manual is written for everyday users. No technical knowledge is required.
Tip: You can open this manual inside Analytics for Spire at any time — click the ? button in the top bar, choose User Manual from your user menu, or press F1. See Section 4: Getting Help Inside the App.
2. First-Time Setup (Setup Wizard)
The very first time Analytics for Spire is opened on a fresh install, a Setup Wizard runs to walk you through initial configuration. This only happens once. After the wizard completes, normal sign-in takes over.
Tip: Your Gemini Logic consultant handles installation and setup, and usually completes the setup wizard with your IT administrator. If the application is already configured at your company, you can skip to Section 3: Logging In.
Step 1 — License
Enter the license details provided by Gemini Logic Inc. when you purchase Analytics for Spire.
Click Validate License. If accepted, you will see a green checkmark and can proceed.
Step 2 — Database Connection
Enter the connection details for your Spire PostgreSQL database:
- Host — the server address (an IP address or server name)
- Port — the port number (default
5432) - Database — the database name (e.g.
your_company_db) - Username — the database login
- Password — the database password
Click Test Connection to confirm Analytics for Spire can reach your database. A green message confirms success. If the test fails, double-check the values with your IT administrator.
Step 3 — Create the Admin Account
Create the first user account, which will be a full administrator:
- Username — the login name
- Display Name — your full name
- Password (and confirm) — minimum 8 characters
Click Create Admin Account.
Step 4 — Complete
A summary screen shows everything is ready. Click Finish. You will be redirected to the Sign In screen, where you can log in with the admin account you just created.
After this initial setup, additional users can be created from the Admin page (see Section 30).
3. Logging In
When you open Analytics for Spire, you will see the sign-in screen.
How to Sign In
- Enter your Username in the first field.
- Enter your Password in the second field.
- Click the eye icon on the right of the password field to show or hide your password.
- Click Sign In.
First Login / Password Reset
If your administrator set a temporary password for you, you will be asked to change it before you can use the application.
- Enter a New Password (minimum 8 characters).
- Enter it again in the Confirm Password field.
- Click Change Password.
You will then be taken to the Dashboard.
New users: When an administrator creates your account, they will usually send you a welcome email with the app address, your username, and a temporary password. Open the address in your browser, sign in with those details, and you will be asked to choose your own password straight away.
4. Getting Help Inside the App
This manual is built into Analytics for Spire, so you never have to go looking for it. There are three ways to open it:
- Click the ? (Help) button in the top bar.
- Click your name in the top-right corner and choose User Manual.
- Press F1 on your keyboard, from any page.
The manual opens on the Help page. A table of contents lets you jump straight to any section, and a search box finds every place a word or phrase is mentioned — for example, type fiscal year or schedule to go right to the relevant instructions. When you’re done, use the navigation tabs in the top bar to go back to what you were doing.
5. The Dashboard
The Dashboard is the home screen you see after signing in. It gives you a quick overview and shortcuts to common tasks.
Note: This page (sometimes called the “Home Dashboard”) is your personal landing screen. It is different from Publishable Dashboards — named, designable, multi-widget dashboards you can publish to a public kiosk URL for TVs and shared screens. See Section 25 for those.
What You Will See
Summary Cards (Top Row) Three cards showing counts of your saved reports, available templates, and favorited items. Click any card to jump to the Templates page.
Quick Actions (Buttons)
| Button | What It Does |
|---|---|
| New Report | Opens the Report Builder to create a tabular report |
| New Pivot | Opens the Pivot Table Builder |
| Browse Templates | Opens the Template Gallery |
| Settings | Opens the Settings page (admin only for configuration) |
Recent Queries (Left Panel) Shows reports you have recently run. Click any entry to reload that exact report.
Favorite Templates (Right Panel) Shows templates you have starred. Click any to load it.
6. Understanding the Screen Layout
Analytics for Spire has a consistent layout across all pages.
Header Bar (Top)
From left to right:
- Sidebar Toggle — the panel icon at the far left shows or hides the left sidebar.
- Analytics for Spire Logo — click to return to the Dashboard. The current version number appears beside it.
- Navigation Tabs — switch between pages:
- Home — the home Dashboard screen
- Report — build and view tabular reports
- Pivot — build and view pivot tables
- Templates — browse and manage templates and saved reports
- Dashboards — design and publish TV / screen dashboards
- Financial — generate Trial Balance, Balance Sheet, P&L, AR/AP Aging, Customer Statements, etc. (only visible to admins or users with the Financial Reports permission)
- Admin — user management (admins only)
- Theme Toggle (sun / moon icon) — switches between light and dark mode. Your choice is remembered the next time you open the app. See Section 27.
- Help (? icon) — opens this User Manual on the Help page. See Section 4.
- AI Assistant (sparkles icon) — opens the AI chat panel on the right. Only visible if your administrator has enabled the AI Assistant. See Section 14.
- Settings (gear icon) — opens the Settings page. An orange dot appears if Analytics for Spire cannot reach the database.
- Database Switcher (database icon) — only appears if you have more than one company configured. Click to switch which Spire database you are reporting on. See Section 7.
- Reset (circular arrow) — clears all current report settings and starts fresh. Only appears when you have tables selected.
- Save (save icon) — saves your current report or template.
- Export (download icon) — exports data to Excel or CSV.
- User Menu (your name, top right) — click to see:
- Your display name, with Administrator or User underneath
- User Manual — opens this manual on the Help page
- Change Password
- Admin (Users), Groups, and Audit Log (admins only)
- Sign Out
Sidebar (Left)
The sidebar is your starting point for building reports. It lists all tables from your Spire database, organized into categories that follow Spire’s modules:
- Reports — curated reporting views your administrator or Gemini Logic has added to the database for special reports (listed first, when present)
- Sales, Customers, Vendors, Purchasing, Inventory, Production / BOM
- Accounts Receivable, Accounts Payable, General Ledger
- Payroll & Employees, Jobs & Phases, Addresses & Contacts, System & Reference
- Other — any remaining tables
Within each category the main tables are listed first; secondary tables are tucked under a collapsible Related group.
Use the search box at the top of the sidebar (Search tables and columns…) to find tables and columns at once. Typing in the box does two things in parallel:
- Tables that match — narrows the category list to tables whose name (or friendly name) contains your search term.
- Columns that match — below the table list, a Columns section appears showing every column in any table whose name matches. Each result is labeled with the table it lives on, so you can see at a glance which “Total” you’re looking at (Sales History? Purchase History? AR Transactions?).
Click a column result to add it to your report instantly — Analytics for Spire adds the table if it isn’t already in your report, ticks the column, and shows a confirmation toast. Click the same result again to remove the column.
The search ranks results so the closest matches come first: an exact name match is shown above a partial one, and “starts with” beats “contains”. Results are capped at 50 columns (“Showing top 50 matches. Refine the search to see more.”) — refine the search term to narrow further.
The expand/collapse state of categories is remembered between sessions, so you don’t have to re-open the same group every time. Clearing the search box restores the normal category browser exactly as you left it.
7. Switching Between Companies (Database Connections)
If your business operates more than one Spire company database, an administrator can configure each one as a separate connection in Analytics for Spire. You can then switch between them at any time.
How Connections Work
- Each connection points to one Spire database (e.g. one company file).
- Only one connection is active at a time — that’s the database the report builder, pivot, and financial reports run against. The active connection is shared by everyone using Analytics for Spire.
- Saved reports, templates, favorites, schedules, and users are shared across all connections — they live in Analytics for Spire, not the Spire database.
- Each company keeps its own fiscal year. Analytics for Spire detects each company’s fiscal year start from Spire, so presets like This Fiscal Year and Last Fiscal Year always follow the calendar of the company you’re reporting on. (An administrator can override it — see Section 31: Settings.)
- Your administrator may limit which companies you can see. If a company is missing from your list, ask them about Connection Access.
Switching Companies
Admins only: Switching the active company changes it for everyone using Analytics for Spire, so only administrators can do it. Other users can still report on several companies at once — see Cross-Company Reports below.
- Click the database icon (Switch database) in the header.
- A dropdown appears listing every configured connection.
- The currently active connection has a blue checkmark. Connections show their name and underneath, the server / database.
- Click any other connection to switch to it.
- The sidebar refreshes to show that company’s tables. A green toast in the corner confirms the switch.
After switching, any unsaved report you were building is preserved, but tables that don’t exist in the new database may need to be re-selected.
Cross-Company Reports
If your business runs one Spire database per company, you can run a single report across several of them at once — for example, combined sales for all your companies.
- In the Report Builder, open the Companies section.
- Click Add company ▾ and tick each company to include. Each selected company appears as a chip; click its X to remove it (at least one company must stay selected).
- Build and run the report as usual.
The same report runs against each selected company and the results are merged into one list. A Company column is added to the start of every row showing which database it came from — filter, sort, group, or pivot on it like any other column, and it is included in exports. If one company can’t be reached (for example during a backup), you’ll see a warning and the other companies’ rows still appear.
Things to know:
- Date presets use the first selected company’s fiscal year.
- The tables and columns you pick must exist in every selected company.
- Pivot Compare Periods isn’t available on cross-company reports, and dashboards, schedules, the AI Assistant, and custom formatted reports work with one company at a time.
Adding More Connections
Connections are added by an administrator on the Settings page — see Section 31: Settings → Database Connections. The dropdown also shows a Manage Connections link for admins as a quick shortcut to the Settings page.
8. Building a Report
Building a report is a step-by-step process: select your data, optionally add filters and sorting, then run the query.
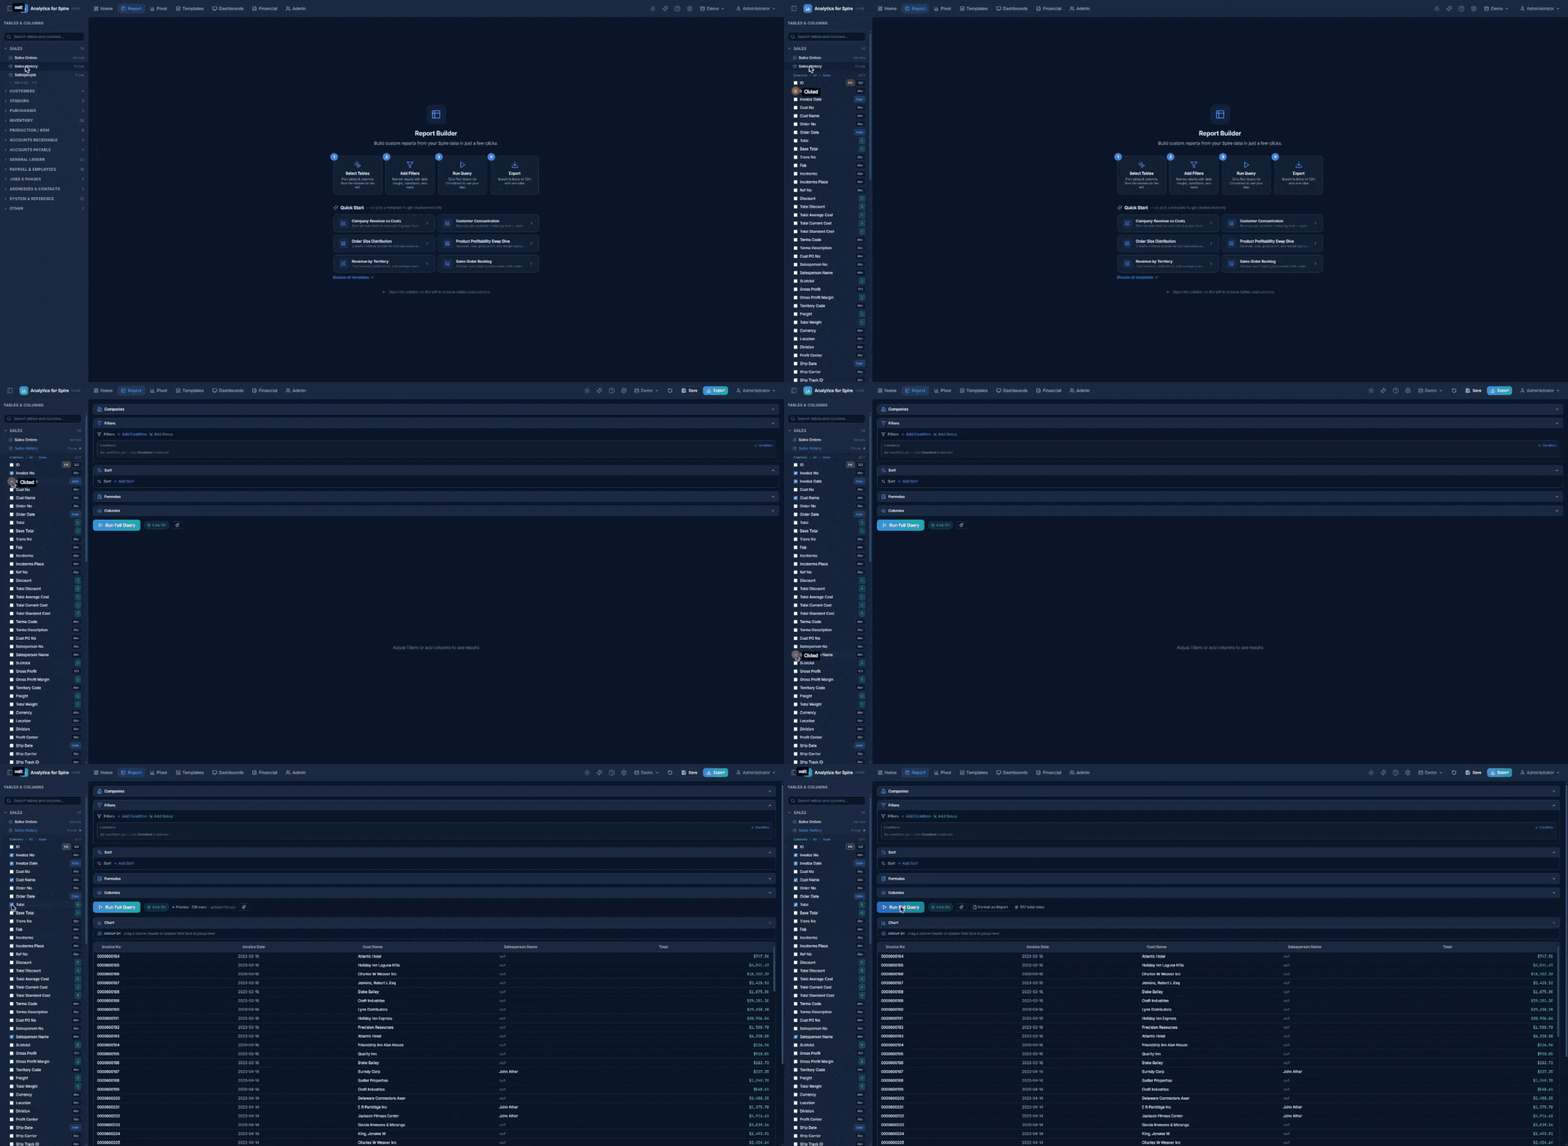
Step 1: Select Tables and Columns
There are two ways to pick fields, and they work together — use whichever is faster for what you’re after.
Browse by table (when you know the table):
- In the left sidebar, find the table you want to report on (e.g. “Sales History”).
- Click the table name to expand it and see its columns.
- Check the boxes next to the columns you want to include.
- Use Common to pick the most useful columns, All to select every column, or None to deselect all.
- Each column shows a small badge indicating its type:
| Badge | Meaning |
|---|---|
| Abc | Text |
| 123 | Number |
| $ | Currency (dollar amounts) |
| Date | Date or date/time |
| T/F | True/False |
| PK | Primary Key (unique identifier) |
| FK | Foreign Key (links to another table) |
| UDF | User-Defined Field |
| fx | Calculated field — a column defined once by your administrator, or one of the built-in columns (see Section 23) |
- To add columns from a second table, expand that table and check its columns too.
Search by field name (when you know the field, not the table):
If you know the column you want but aren’t sure which table holds it, type the field name into the sidebar search box. Matching columns appear under a Columns section labeled with their parent table — for example, searching salesperson shows every table that has a Salesperson column (Sales Orders, Sales History, Customer, etc.). Click any result to add that column to your report in one click — the table is added if needed and the box is ticked automatically. Clicking the same result again removes the column.
This is by far the fastest way to find common fields like total, customer no, invoice date, etc. across the ~137 tables in a Spire database.
Showing and Hiding Columns
Sometimes you need a column to filter, join, or calculate with, but you don’t want it cluttering the results. Open the Columns section in the Report Builder (eye icon) — every selected column is listed with an eye icon. Click a column to hide it (Hidden — click to show), or use Show all / Hide all.
Hidden columns are left out of the data grid, charts, and exports, but still work in filters, sorting, joins, and formulas.
Step 2: Joins (Connecting Multiple Tables)
When you select columns from two or more tables, Analytics for Spire tries to figure out how those tables are related and connects them automatically with a join.
The Joins section in the main area shows each connection:
- From Table.Column → To Table.Column
- A dropdown to choose the join type:
- INNER JOIN — only shows rows that exist in both tables (most common).
- LEFT JOIN — shows all rows from the first table, even if there is no match in the second.
- RIGHT JOIN — shows all rows from the second table, even if there is no match in the first.
If no join was detected you will see “No join detected. Add one below or results may be a cross product.” Click + Add Join, pick a table and Column… on each side and the join type, then click Add Join. Suggested matches appear as chips under Suggested: (for example Part No ↔ Part No) — click one to use it. Use the pencil (Edit join) or X (Remove join) on any join row to change it.
Joining on more than one column. Some Spire tables are keyed on two columns. Inventory, for example, has one row per part and warehouse, so joining Inventory to Inventory Statistics on Part No alone would multiply quantities for parts stocked in several warehouses. Add a second join row between the same two tables (e.g. one for Part No and one for Whse) — Analytics for Spire combines them into a single join that matches on both. Auto-detect suggests both columns together when both tables have them.
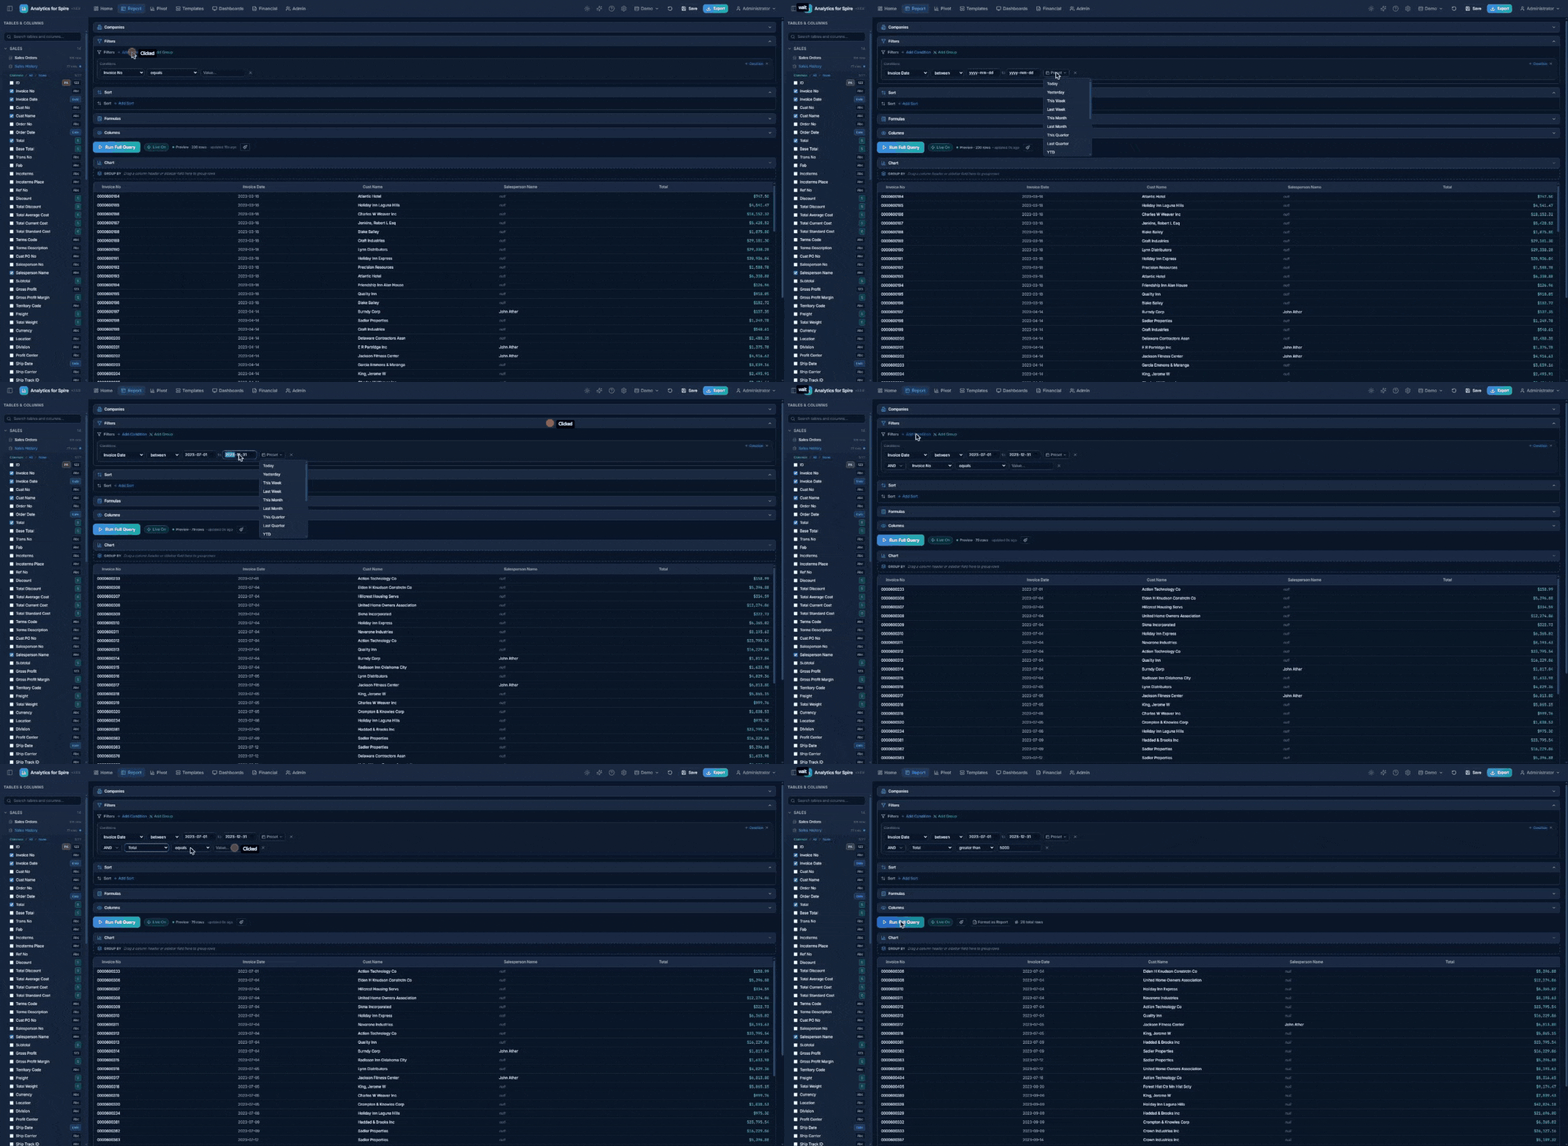
Step 3: Add Filters (Optional)
Filters narrow down your results. For example, you might want to see only invoices from this year, or only orders above $1,000.
- In the Filters section, click + Add Condition.
- Choose the Column you want to filter on.
- Choose an Operator:
For text columns:
| Operator | Meaning |
|---|---|
| equals | Exact match |
| not equals | Everything except this value |
| contains | Includes this text anywhere (not case-sensitive) |
| starts with / ends with | Begins or ends with this text |
| is null / is not null | Has no value at all / has any value |
| is blank (null or empty) / is not blank | Has no value or only an empty value / has real text |
For number and currency columns:
| Operator | Meaning |
|---|---|
| equals / not equals | Exact match / everything except this value |
| greater than / less than | Above / below this value |
| greater or equal / less or equal | At or above / at or below this value |
| between | Within a range (two values, separated by “to”) |
For date columns:
| Operator | Meaning |
|---|---|
| between | Within a date range (the default) |
| equals | On a specific date |
| after / before | After / before a date |
| on or after / on or before | Including the date itself |
For Yes/No columns: equals (Yes or No).
- Enter the value(s) for the filter.
- To add more conditions, click + Add Condition again. Choose AND (all conditions must be true) or OR (any condition can be true) between them.
Note: A freshly-added condition with no value entered is ignored — it won’t accidentally zero out your results. Just type a value to activate it. (The “is null”, “is blank” and similar operators need no value and always apply.)
Filter Groups — Mixing AND and OR
To say something like “(Status is Open or Status is Pending) and Total is over 1,000”, use groups:
- Click Add Group. Your conditions are now organized into cards titled Group 1, Group 2, and so on.
- Use each card’s + Condition button to add conditions to that group, and choose AND/OR between the conditions inside it.
- Choose AND/OR in the dropdown between the groups.
Each group works like a set of parentheses. Click the X on a card to remove that group.
Keeping Unmatched Rows (“In join”)
When you use a LEFT JOIN — for example, all inventory items, with their sales statistics where they have any — a normal filter on the joined table quietly removes the items that have no match. Filtering Inventory Statistics to Last 24 Months would drop every part that hasn’t moved in that time, which is often exactly the list you wanted to see.
Conditions on a LEFT-joined table show a small In join pill (link icon). Click it to apply that condition inside the join instead: every row from the main table is kept, and rows with no matching data in the joined table simply show blank values. Click it again to go back to filtering normally.
- The pill only takes effect for a LEFT JOIN, and only when the condition is connected with AND (no OR inside its group or between its group and the next). If those rules aren’t met, the pill is dimmed with a “Not in effect” tooltip and the condition filters normally.
- Changing the condition to a column from a different table turns the option off.
Date Presets
When filtering a date column, a Preset button appears so you can quickly select a common date range instead of typing dates manually:
| Preset | Date Range |
|---|---|
| Today | Today only |
| Yesterday | Yesterday only |
| This Week | Monday through today |
| Last Week | Previous Monday to Sunday |
| This Month | 1st of this month through today |
| Last Month | Full previous month |
| This Quarter | Start of current quarter through today |
| Last Quarter | Full previous quarter |
| YTD (Year to Date) | January 1st through today |
| Last Year | Full previous year |
| Last 7 / 30 / 90 Days | Rolling window |
| Last 12 Months | Past year from today |
| Last 24 Months | Past two years from today |
| This / Last Fiscal Year | Based on the company’s fiscal year start month |
| Last Hour / 4 / 8 / 12 / 24 Hours | Rolling window to the minute — shown under Recent, only on columns that store a time as well as a date |
Selecting a preset automatically fills in the date values (and sets the operator to between). These dates are recalculated each time you run the report, so “Today” always means today. To use your own dates, just type them into the two date boxes.
Inventory Statistics tip: Filter Inventory Statistics on Period Date, never on Year End. Year End is the fiscal year-end date, so for the current year it’s in the future and “to today” presets (YTD, This Fiscal Year, Last 24 Months) leave the current year out. See Built-In Calculated Columns.
Step 4: Add Sorting (Optional)
Sorting controls the order of your results.
- Click + Add Sort.
- Choose the Column to sort by.
- Click the direction button to toggle:
- ASC (ascending) — A to Z, smallest to largest, oldest to newest.
- DESC (descending) — Z to A, largest to smallest, newest to oldest.
- Add multiple sorts to break ties (e.g. sort by Date descending, then by Customer ascending).
Step 5: Run the Query
Click the Run Query button (or press Ctrl + Enter).
- The button shows “Running…” while data is being retrieved.
- Once complete, the total row count appears (e.g. “1,234 total rows”).
- If there is a problem, an error message appears in red below the button.
9. Working with the Data Grid
After running a query, your results appear in a data grid (a table of rows and columns).
Sorting Columns
Click any column header to sort by that column. Click again to reverse the direction. A small arrow indicates the current sort direction.
Resizing Columns
Hover over the right edge of a column header until you see a resize cursor. Click and drag left or right to make the column wider or narrower.
Reordering Columns (Drag and Drop)
You can change the order of columns in the grid by dragging:
- Hover over a column header — a small grip handle appears (Drag to reorder, group, or remove).
- Drag the column onto another column’s header to move it there.
- Release to drop.
The new order is remembered when you save the report or template. Columns you add later appear at the end.
Group-By Bar (Row Grouping)
Above the data grid is a Group by bar (“Drag a column header or sidebar field here to group rows”) that lets you collapse rows into expandable groups by one or more columns. For example, you can group sales by Customer to see one row per customer with all their invoices nested underneath.
To group:
- Drag a column header up onto the Group-By bar, or
- Drag a column from the sidebar onto the bar.
To expand a group:
- Click the chevron arrow at the start of the group row.
Aggregations on grouped data: When grouping is active, each numeric column header shows a small picker — click it to cycle how its values are summarized in the group totals: SUM, AVG, COUNT, MIN, or MAX.
Totals cover the whole report. While grouping is on, Analytics for Spire loads up to 10,000 rows (instead of one page) so group totals cover the full result. Paging is hidden and a note shows how many rows are included. If your report has more than 10,000 rows, you’ll be prompted to use the Pivot tab instead, which totals any number of rows.
To remove grouping:
- Click the X on a group chip (Remove from grouping), or drag the chip off the bar.
Grouping and the chosen summaries are saved with the report or template.
Column Filters (Search Within Results)
- Click the Column Filters button below the grid to show a filter row.
- Type into any column’s filter box to instantly narrow the displayed rows.
- This filters only the data already on screen — it does not re-query the database.
The bottom-right corner shows how many rows match (e.g. “42 of 1,234 rows”).
Footer Aggregations
- Click the Footers button below the grid to show a totals row at the bottom.
- Click any numeric column’s footer cell to cycle through aggregation functions:
- SUM — Total of all values
- AVG — Average
- COUNT — Number of rows
- MIN — Smallest value
- MAX — Largest value
- Click again to cycle to the next function, or click once more to turn it off.
Non-numeric columns only support COUNT.
Data Formatting
- Currency values are right-aligned and formatted as
$1,234.56. - Dates are formatted as
YYYY-MM-DD. - Numbers include comma separators (e.g.
1,234).
Pagination
If your results exceed the page size, pagination controls appear at the bottom:
- Use the < and > arrows to move between pages.
- The current page number and total pages are shown (e.g. “Page 3 of 12”).
- You can change the number of rows per page using the page size dropdown.
10. Live Preview
Live Preview automatically re-runs your query in the background while you tweak filters, columns, and other settings — so you see results update as you build, without having to click Run Query every time.
Turning Live Preview On or Off
A small Live Preview toggle sits near the Run Query button. Click it to turn live preview on or off. Your preference is remembered between sessions.
How It Works
- Each time you change the configuration, Analytics for Spire waits about half a second, then re-runs a small preview of the query (typically the first 200 rows).
- A “preview” badge appears above the data grid while live preview is active, so you know you are not seeing the full result set.
- To see the full result, click Run Query as normal.
Pivot Tables
In the Pivot view, live preview is even faster — when your dataset is small enough to compute in the browser, dragging fields between zones updates the pivot instantly, with no server round-trip. For very large datasets, the pivot falls back to a server query when you click Run.
11. Building a Pivot Table
A pivot table reorganizes your data into a cross-tabular summary. For example, you could see total revenue broken down by Customer (rows) and Salesperson (columns).
How to Build a Pivot Table
- Click the Pivot tab in the header.
- Make sure you have selected tables and columns in the sidebar (same as a regular report).
The Pivot Builder
You will see an Available Fields area at the top showing all your selected columns, and four drop zones below it.
Drag fields from Available Fields into the appropriate zone:
| Zone | Purpose | Example |
|---|---|---|
| Rows | Categories shown as row labels on the left | Territory, Customer Name |
| Columns | Categories shown as column headers across the top | Salesperson, Month |
| Values | Numbers to be summarized in each cell | Total, Quantity, Invoice Count |
| Filters | Pre-filter data before pivoting | Date range, Status |
You can also reorder fields within a zone by dragging them up or down.
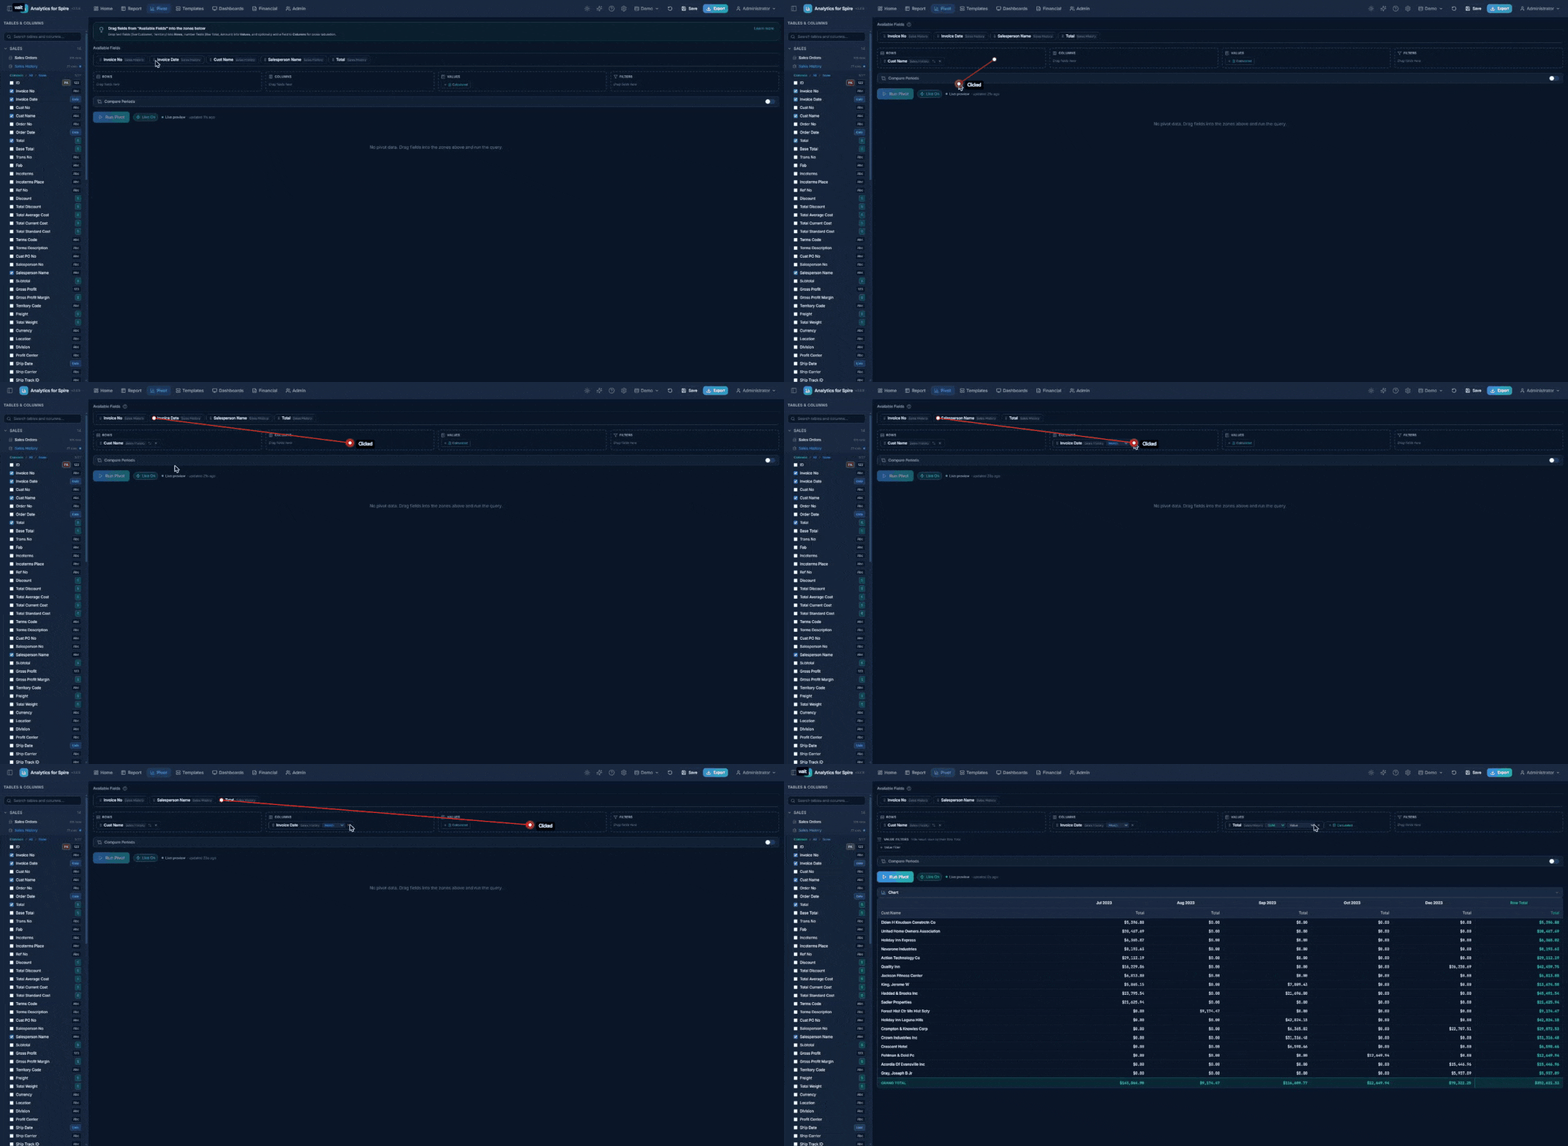
Setting Filter Conditions (Filters Zone)
When you drop a field into the Filters zone, a condition editor opens automatically so you can say how to filter:
- Text fields — equals, not equals, contains, is empty / is not empty.
- Number and currency fields — = ≠ > < ≥ ≤ and between.
- Date fields — pick a date preset (Today, This Month, YTD, This Fiscal Year, …) or enter a custom range. Presets are recalculated every time the pivot runs, so a saved pivot filtered to “This Month” always means the current month.
- Yes/No fields — choose Yes or No.
Each filter chip shows its condition as a small badge (for example = West or This Year). Click the chip any time to change the condition. A chip showing an amber “set condition” badge has no criteria yet and will not filter anything until you set one.
These filters apply to the source data before it is aggregated — for example, “only invoices from Ontario” or “only this fiscal year.”
Value Filters (Filtering the Results)
Below the drop zones you will find the Value Filters bar (it appears once you have at least one Value field). Value filters work on the aggregated results — each pivot row’s Row Total — rather than the source data:
- Click + Value Filter.
- Pick the value field, an operator (≠ = > < ≥ ≤), and a number.
Common uses:
- Revenue ≠ 0 — hide customers whose invoices and credits net to zero. (A source filter cannot do this: a +$500 invoice and a −$500 credit are each non-zero, but their total is zero.)
- Revenue > 10,000 — show only significant rows.
Column totals and the grand total recalculate from the visible rows, so what you see always adds up. Value filters are saved with the report, and exports, dashboards, and scheduled emails all honor them.
Choosing an Aggregation Function
When you drag a field into the Values zone, you must choose how to summarize it:
| Function | What It Does | Example |
|---|---|---|
| SUM | Adds up all values | Total revenue |
| AVG | Calculates the average | Average order size |
| COUNT | Counts the number of rows | Number of invoices |
| MIN | Finds the smallest value | Lowest sale |
| MAX | Finds the largest value | Highest sale |
Click the function name next to the field to change it.
Show as percentages. Each value chip also has a display dropdown (Show as value or percentage): Value, % of Row, % of Column, or % of Total (the grand total).
Subtotals. When you have two or more fields in Rows, tick Show Subtotals to add a subtotal row (tagged Total) for each group of the outer field.
Calculated Values
A calculated value is a formula over your other value fields — for example, Average Order Value = Revenue ÷ Invoice Count.
- In the Values zone, click the dashed Calculated button.
- In the Add Calculated Value dialog, enter a Label (e.g. Avg Order Value).
- Enter the Formula, referring to other values by their label in curly braces — e.g.
{Revenue} / {Invoice Count}. Click the chips under Insert: to add a reference without typing it. Supported:+ - * / ( )and numbers. - Choose a Format: Number, Integer, Compact (1.2K), Currency, Currency compact ($1.2K), or Percent.
- Click Add.
Calculations run on the already-totaled cell values, not on raw rows — so the Grand Total for Avg Order Value is total revenue divided by total invoices, which is the correct answer (not the sum of every row’s average). Division by zero shows a blank. Click a calculated chip any time to edit it. A calculated value can’t refer to itself or to another calculated value.
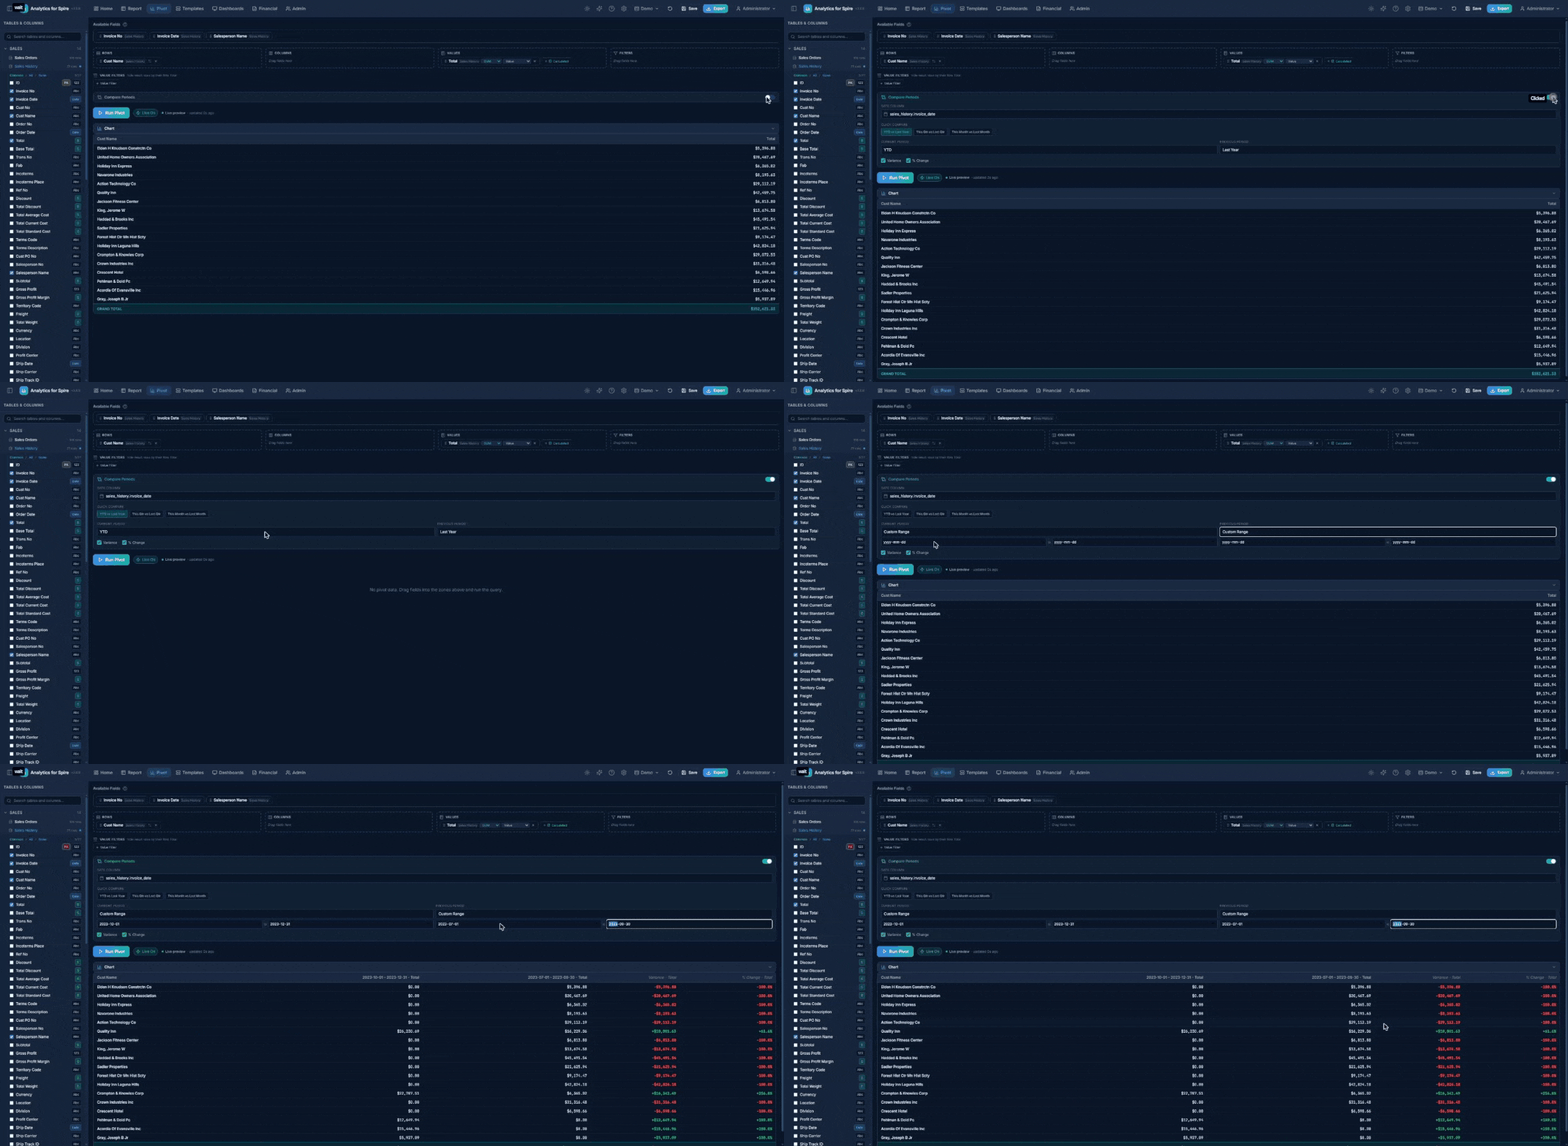
Compare Periods
Compare Periods puts two date ranges side by side — this year vs. last year, this quarter vs. last quarter, or any two ranges you choose.
- Turn on the Compare Periods switch.
- Choose the Date Column to compare on (e.g. Invoice Date).
- Click a Quick Compare chip — YTD vs Last Year, This Qtr vs Last Qtr, or This Month vs Last Month — or set the Current Period and Previous Period yourself. Each can be any date preset or Custom Range (enter a start and end date).
- Tick Variance and/or % Change (both on by default).
- Run the pivot.
Each value field then shows a column for the current period, one for the previous period, and the Variance and % Change between them. Presets are recalculated every time you run, so a saved “YTD vs Last Year” pivot is always current.
Running the Pivot
Click Run Pivot (or press Ctrl + Enter).
- You must have at least one field in Rows and one in Values for the button to be active.
- The pivot grid appears showing your cross-tabulated data.
Reading the Pivot Grid
- Row labels appear on the left (grouped by your Row fields).
- Column headers appear across the top (grouped by your Column fields).
- Cell values are the summarized numbers where each row and column intersect.
- Row Total appears on the right edge — the total across all columns for that row.
- Column Totals appear at the bottom — the total down all rows for that column.
- Grand Total appears at the bottom-right corner — the overall total.
12. Drilling Down from Pivot Cells
Click any cell in the pivot grid to see the detailed rows that make up that number.
A popup window opens showing:
- The filters that were applied to get that number (e.g. Territory = “West”, Salesperson = “Jane”)
- A data grid with all matching rows (up to 500)
- A close button (X) in the top-right corner
This is useful for verifying totals or investigating specific data points. The drill-down respects all the filters that were active on the pivot, plus the row/column values for the cell you clicked.
13. Using Charts
You can visualize your data with charts in both the Report and Pivot views.
How to Use Charts
- After running a query, look for the Chart section above the data grid.
- Click to expand it.
- Choose your chart type:
| Chart Type | Best For |
|---|---|
| Bar | Comparing categories side by side |
| Line | Showing trends over time |
| Pie | Showing proportions of a whole |
| Area | Showing volume trends over time |
- Select which column to use for the X-Axis (horizontal — usually text or dates).
- Select which column to use for the Y-Axis (vertical — usually numbers or currency).
- Optionally choose a Group By column to split the data into multiple series.
Hover over bars, lines, or pie slices to see the exact values.
14. The AI Assistant
Analytics for Spire includes an optional AI Assistant powered by Claude, the assistant from Anthropic. It lets you describe what you want in plain English, and it builds the report configuration for you.
Note: The AI Assistant must be enabled by an administrator on the Settings page before it can be used. The sparkles icon will not appear in the header otherwise.
Opening the Assistant
- Click the sparkles icon in the header, or
- Press Ctrl + Shift + A
A chat panel slides in from the right side of the screen.
Asking for a Report
Type your question into the text box at the bottom of the panel and press Enter (or click the send arrow). For example:
- “Show me sales by customer this year.”
- “What are my top 10 products by revenue?”
- “Show inventory items below reorder point.”
- “Build a pivot of revenue by territory and salesperson for last quarter.”
- “Generate a Profit & Loss for last month.” (if you have permission to view financial reports)
The Assistant streams its response in the chat, and when it has decided on a configuration, it shows a card describing the report it has built — for example, the tables, columns, filters, and pivot setup it picked.
Applying the Suggestion
Each report card has an Apply button. Click it to load that configuration into the Report Builder (or Pivot, or Financial Reports — wherever it belongs). You can then tweak the settings, click Run, save it, schedule it, or anything else.
Other Controls
- New shift+enter inside the input box — adds a new line without sending.
- Clear chat (trash icon at top of panel) — wipes the conversation history.
- Stop (square icon) — appears while the Assistant is responding; click to cancel the current response.
- Close (X) — hides the panel. Your conversation is kept until you clear it.
Privacy
Your data is not sent to the AI for analysis. Only your messages and a description of your database structure (table names and column names) go to the AI service so it can pick the right tables. The actual data rows are read directly from your Spire database by Analytics for Spire — they never pass through the AI.
15. Financial Reports
The Financial tab in the header opens a gallery of professional, pre-formatted reports that match how an accountant or controller expects to see them. These are different from regular reports in that they have proper sections, subtotals, headers, and accounting layout.
Permission required: The Financial tab is only visible to administrators and to users who have been granted the Financial Reports feature permission. See Section 30: Administration.
Built-In Financial Reports
| Report | What It Shows |
|---|---|
| Trial Balance | Account balances with debit and credit columns as of a specific date |
| Balance Sheet | Assets, Liabilities, and Equity as of a specific date |
| Profit & Loss (P&L) | Revenue and expenses for a date range, with optional year-over-year comparison |
| Cash Flow | Cash inflows and outflows categorized as Operating, Investing, or Financing |
| AR Aging | Outstanding customer balances as of any date, aged by days past due (Current, 1–30, 31–60, 61–90, Over 90) |
| AP Aging | Outstanding vendor balances as of any date, aged by days past due |
| Customer Statement | Transaction history with running balance for one customer (invoices, payments, credits) |
| Inventory Valuation | Stock quantities and values by product, optionally filtered by warehouse or product type |
| Sales Tax Summary | Sales tax collected, grouped by period |
Generating a Financial Report
- Click the Financial tab.
- The gallery shows a card for each report type. Click the report you want.
- A Parameters screen appears asking for the inputs the report needs (typically a date or date range, sometimes a division, currency, customer, etc.).
- Fill in the parameters and click Generate.
- The formatted report appears with proper section headers, subtotals, and grand totals.
Working with the Generated Report
While viewing a financial report you can:
- Print — uses your browser’s print dialog with print-friendly styling.
- Export to Excel — downloads a formatted Excel file.
- Export to CSV — downloads a plain CSV.
- Back to Gallery — returns to the report list to choose a different report.
- Change Parameters — reopens the parameter screen for the same report so you can adjust dates or filters.
AR & AP Aging in Depth
The two aging reports are point-in-time: pick any As of Date — last month-end, last quarter, any historical date — and the report reconstructs what was actually outstanding on that date using Spire’s payment application history. An invoice that was open then but has since been paid still appears; a payment applied after the as-of date is not counted. This means the report matches Spire’s own aging for the same date, including partially-paid invoices.
How amounts are aged. Each open amount lands in a bucket based on days past due (compared to the invoice’s due date; invoices without a due date age from their transaction date):
| Bucket | Meaning |
|---|---|
| Current | Not yet due as of the aging date |
| 1–30 / 31–60 / 61–90 | That many days past due |
| Over 90 | More than 90 days past due |
Payments and credits that were unapplied as of the date appear as negative amounts (a credit on the account), so each vendor or customer’s total reconciles to the subledger.
Show Invoice Detail. Tick this parameter to list every individual open transaction instead of one line per customer/vendor. Each row shows the customer or vendor number and name, the document number, type (Invoice / Payment / Credit Memo / Debit Memo), date, due date, and days past due, with the amount in the aging column it falls into. The list is a single flat table — easy to sort, filter, or paste into Excel — and ends with a Grand Total row, so the detail visibly reconciles to the summary. This is the easiest way to answer “which invoices make up that 90+ number?”
Ignore Items Before. Old open stragglers — an unapplied credit memo from years ago, an ancient disputed invoice — are legitimately part of the balance, so the report never drops them on its own. If you want them out of the way, enter a date in Ignore Items Before and anything dated earlier is left out. The report footer notes when this cutoff is active, so nobody mistakes the result for the full balance. Leave it blank (the default) to include everything.
Other parameters. AR Aging can be filtered by Territory. Both reports accept a Minimum Balance to hide small accounts, and customers or vendors whose open items net to zero are left out automatically. The report footer always states how the numbers were computed.
Customer Statements
The Customer Statement report shows one customer’s transactions with a running balance — invoices, payments, credit memos, and debit memos. Parameters:
- Customer, Start Date, and End Date — whose statement and for which period.
- Open Items Only — show only the items still outstanding (the statement is then titled “as of” the end date rather than a date range).
- Include Aging Summary (on by default) — adds an aging strip to the statement showing how the customer’s open balance splits across Current, 1-30, 31-60, 61-90, and Over 90 days past due. The strip (headed Account Aging as of the end date) appears on the PDF and Excel copies of the statement, including emailed statements.
To email statements to many customers automatically, see Section 21: Customer Statement Runs.
Multi-currency. Amounts are handled per account currency automatically — base-currency vendors/customers use the standard amounts, foreign-currency ones use base-currency equivalents at each invoice’s booked rate — so mixed-currency companies see correct, comparable totals.
Multi-Currency Companies
If your Spire database is configured for multiple currencies, financial reports automatically pin to your base currency unless you pick a specific currency from the parameter dropdown. This prevents the inflated totals that can occur when accounts have parallel rows for each currency variant.
16. Custom Formatted Reports
Beyond the built-in financial reports, Analytics for Spire lets you design your own custom formatted reports with the same professional look. There are three ways to create one — pick the one that best matches what you already have.
Way 1 — Format an Existing Report (“Format as Report”)
If you have already built a regular tabular report and want to turn it into something more presentation-ready (with section breaks and subtotals):
- In the Report Builder, run your query so you can see the data.
- Click the Format as Report button (above the data grid).
- The Format as Report dialog opens. Choose:
- Group By — pick a column whose distinct values will become section headers (e.g. “Salesperson” creates one section per salesperson).
- Subtotal Columns — pick the numeric columns that should be totaled at the bottom of each section.
- A live preview shows what the formatted report will look like.
- Click Save as Custom Report to name and save it. It will appear in the Custom Reports list on the Financial tab.
Way 2 — Customize a Built-In Report
If a built-in financial report is almost what you want but you’d like to adjust the columns or grouping:
- Open the Financial tab.
- Each report card has a Customize button. Click it on the one closest to what you want.
- The Customize dialog opens, pre-filled with that report’s structure. You can:
- Change which columns appear and their order
- Add or remove subtotals
- Add or remove section breaks
- Give your version a name and click Save as Custom Report.
Your customized version appears under Custom Reports at the bottom of the Financial tab. The original built-in report is unchanged.
Way 3 — Build From Scratch (Custom Report Designer)
For full control, click Create Custom Report at the top of the Financial tab. This opens the Custom Report Designer, a 6-step wizard:
- Data Source — pick the tables you want to draw from.
- Sections — define how the report should be sectioned (e.g. by Customer, by Account Type, by Department). You can have nested sections.
- Columns — choose which columns appear, set their widths, and pick their data type (text, number, currency, date).
- Subtotals — pick which numeric columns should be totaled at each section break and at the very bottom (grand total).
- Parameters — optional. Define the input fields that will appear when someone runs the report (e.g. a date range, a division dropdown). The report can use these to filter data automatically.
- Preview — see the finished report rendered with sample data. If it looks right, click Save Report.
Running a Custom Report
Custom reports appear in their own section under the Financial tab. Click any custom report card to open it, fill in any parameters you defined, and click Generate.
AI Assistant + Custom Reports
If the AI Assistant is enabled, you can simply ask it to build a formatted report — for example:
“Build me a sales report grouped by salesperson with totals for revenue and units sold.”
The Assistant produces a formatted-report configuration with an Apply button that opens it in the Custom Report Designer for review and saving.
17. Exporting Your Data
You can download your report or pivot table results as an Excel or CSV file.
How to Export
- After running a query, click the Export button in the header (or press Ctrl + E).
- The Export dialog opens.
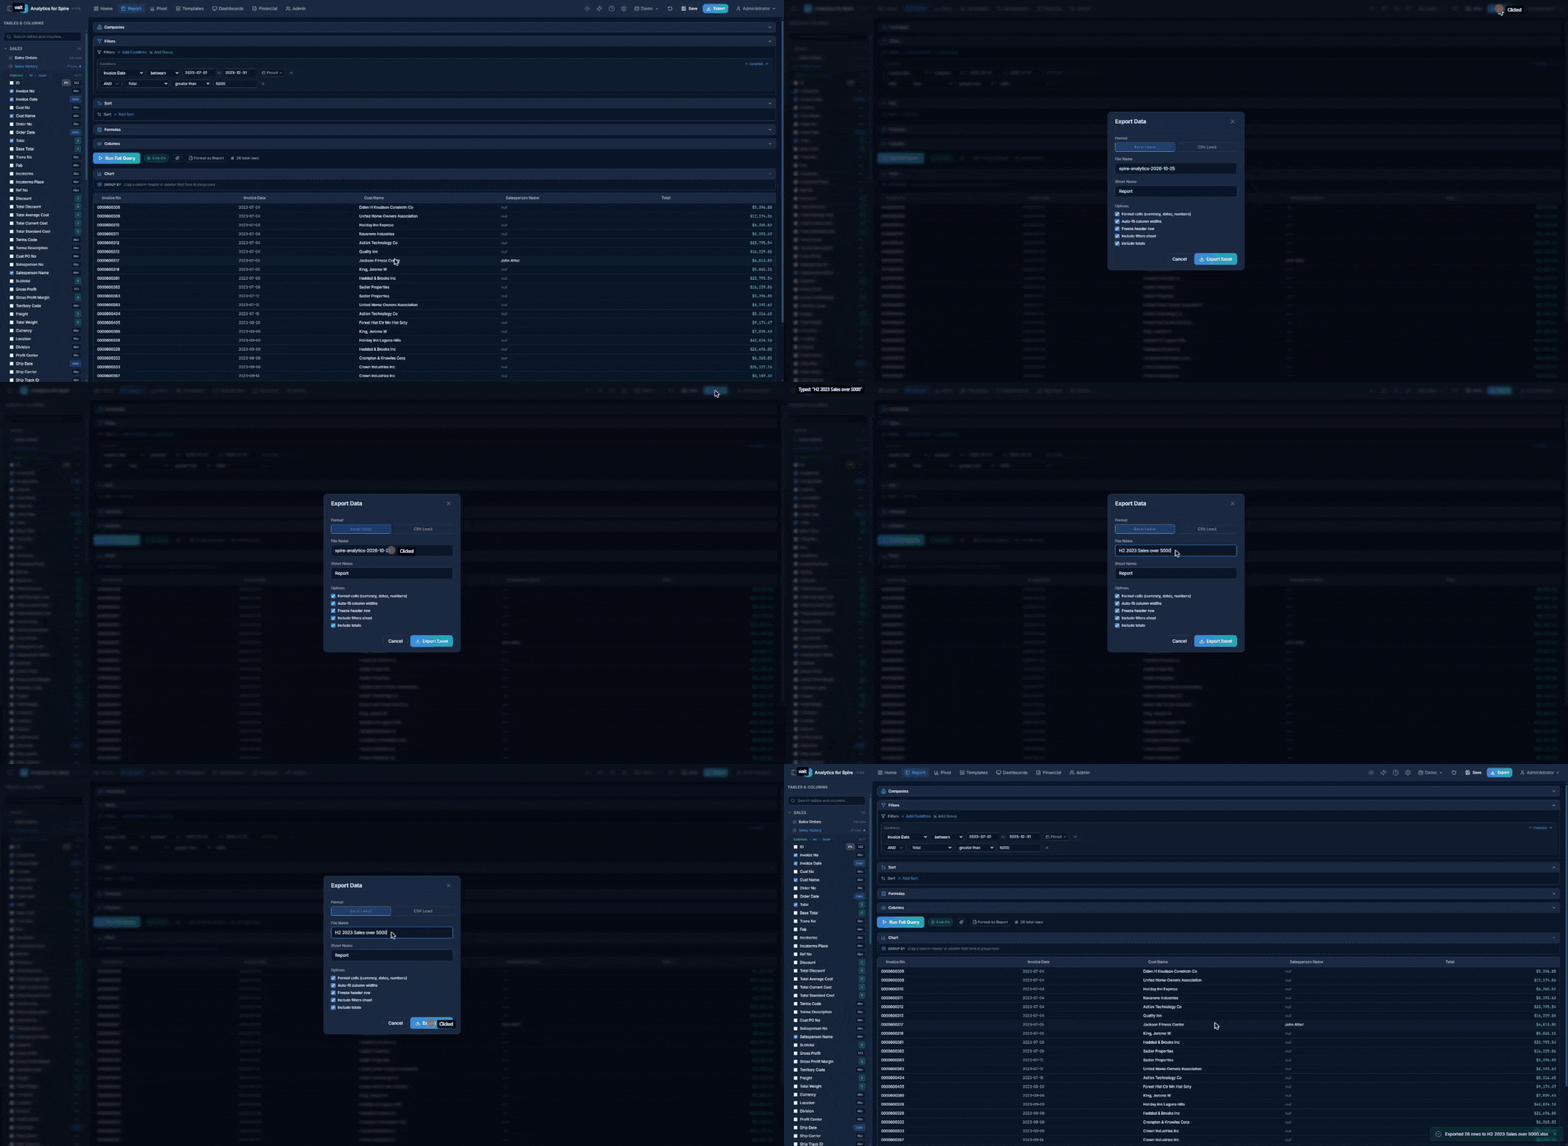
Choosing a Format
Click one of two buttons at the top of the dialog:
- Excel (.xlsx) — a formatted spreadsheet that opens in Microsoft Excel.
- CSV (.csv) — a plain text file compatible with any spreadsheet program.
Excel Export Options
| Option | What It Does | Default |
|---|---|---|
| File Name | Name of the downloaded file | Report name + today’s date |
| Sheet Name | Name of the sheet tab in Excel | “Report” or “Pivot” |
| Format Cells | Apply currency, date, and number formatting | On |
| Auto-fit Column Widths | Automatically size columns to fit content | On |
| Freeze Header Row | Keep the header row visible when scrolling | On |
| Include Filters Sheet | Add a second sheet listing your active filters | On |
| Include Totals | For pivot tables, include row/column/grand totals | On |
Downloading
Click the Export Excel or Export CSV button. The file will download to your computer. A success message appears confirming the export.
18. Templates
Templates are pre-built report configurations that you can load with one click. Analytics for Spire comes with about 60 system templates organized by category — Sales, Inventory, Purchasing, GL & Financials, Executive, Operations, and Production. For example, Inventory Sales Statistics shows quantity, sales, cost, gross profit, and margin % by part and fiscal year.
Browsing Templates
- Click the Templates tab in the header.
- You will see a gallery of template cards organized by category.
Searching and Filtering
- Search box — type to find templates by name or description.
- Category buttons — click a category (Sales, Inventory, Purchasing, etc.) to filter. Click “All” to show everything.
- Favorites button — click the star to show only templates you have starred.
Template Card Information
Each template card shows:
- Icon — represents the template type.
- Name — the template’s title.
- Description — a brief summary of what the report shows.
- Category badge — which category it belongs to (e.g. Sales).
- Type badge — either “Report” (tabular data) or “Pivot” (cross-tabulation).
- Lock icon — appears on system templates (pre-built, cannot be deleted).
Loading a Template
- Click the Load button (blue/teal gradient) on a template card.
- The template’s configuration loads — tables, columns, filters, and sorting are all set up for you.
- You are taken to the Report or Pivot page (depending on the template type).
- Date presets (like “YTD” or “Last 30 Days”) are recalculated to today’s date.
- Click Run Query to see the results.
- You can modify the filters, sorting, or columns before running — changes do not affect the template.
Template Actions
Each template card has action buttons along the bottom:
| Button | Icon | What It Does |
|---|---|---|
| Favorite | Star | Add or remove from your favorites |
| Load | Play arrow | Load the template into the Report/Pivot builder |
| Duplicate | Copy | Create a personal copy of the template |
| Export | Download arrow | Save the template as a JSON file for sharing |
| Schedule | Clock (saved reports only) | Set up automatic email delivery |
| Delete | Trash can (your templates only) | Delete a template you created |
Importing and Exporting Templates
Export templates:
- Click the Export button in the top-right of the Templates page.
- Select which templates to include.
- Click Export. A JSON file downloads to your computer.
Import templates:
- Click the Import button in the top-right of the Templates page.
- Select a JSON file previously exported from Analytics for Spire.
- If any template names already exist, you will be prompted to rename them.
- The imported templates appear in your gallery.
19. Saving Reports
You can save your current report configuration for quick access later.
How to Save
- Set up your report (select tables, columns, filters, sorting, etc.).
- Click the Save button in the header (or press Ctrl + S).
- The Save dialog opens.
Save vs. Save As. If you loaded a saved report (its name appears as a small chip in the header), the dialog offers two choices at the top:
- Save — Update “[report name]”: overwrites the saved report with your current settings. Click Update to confirm.
- Save As… — Create a new copy: saves your settings as a new report or template, leaving the original untouched.
If the report you are overwriting is used by active email schedules, a yellow warning lists them — “This report is on N active schedules — saving will change what gets emailed.” Use Save As if you only want a personal copy.
When saving something new (or choosing Save As…), pick one of two options:
Save as Report
Saves your current configuration with the exact filter values you entered. Best for reports you run regularly with the same settings.
- Name (required) — give your report a meaningful name (e.g. “January Sales Summary”).
- Description (optional) — add notes about what the report shows.
- Share with other users — check this box if you want other users to see your report.
Save as Template
Saves your configuration as a reusable template that appears in the Template Gallery. Best for configurations that others might use.
- Name (required) — a descriptive template name.
- Description (optional) — what this template is for.
- Category — choose from: Executive, Sales, Inventory, Purchasing, GL & Financials, Production, Operations, or Custom.
- Share with other users — check to make it visible to all users.
If you are on the Pivot page and have configured pivot fields, a message confirms that the pivot configuration will be included.
Viewing Your Saved Reports
Your saved reports appear at the bottom of the Templates page in the My Saved Reports section. From there you can:
- Load — open the report and run it.
- Schedule — set up automatic email delivery (see next section).
- Delete — remove the saved report.
20. Scheduled Email Reports
You can schedule any saved report — flat reports, pivots, and custom formatted reports — to be automatically generated and emailed as an Excel attachment on a recurring basis. Pivots arrive with the cross-tab on the first sheet and raw rows on a second sheet; custom formatted reports arrive with the same sectioned layout, subtotals, and grand total as the in-app Excel export.
Note: Your administrator must configure SMTP (email server) settings before this feature will work. See Section 31: Settings.
Creating a Schedule
- Go to the Templates page.
- Scroll down to the My Saved Reports section.
- Find the report you want to schedule.
- Click the Schedule Email (clock) icon on the report card.
- The Schedule dialog opens.
Schedule Settings
Schedule Name A name for this schedule. Defaults to “[Report Name] Schedule”. You can change it.
Frequency Choose how often the report should be sent. Click a preset button for common options:
| Preset | Schedule |
|---|---|
| Daily at 8am | Every day at 8:00 AM |
| Weekly (Mon 8am) | Every Monday at 8:00 AM |
| Monthly (1st 8am) | First day of each month at 8:00 AM |
| Every 6 hours | Every 6 hours around the clock |
| Custom | Enter your own schedule using cron format |
For Custom schedules, enter a cron expression in the format minute hour day-of-month month day-of-week. For example:
0 9 * * 1-5— Weekdays at 9:00 AM30 17 * * 5— Fridays at 5:30 PM0 8 15 * *— 15th of each month at 8:00 AM
Recipients
Enter email addresses separated by commas. Each address is validated.
Example: jane@company.com, bob@company.com
When to send
- Every run (default) — the report is emailed every time the schedule fires.
- Only when matches — turns the schedule into an alert (see below).
Alert Emails (Send Only When Something Matches)
An alert schedule runs the report on its schedule but only sends an email when at least one row meets your conditions — for example, “email me when any invoice is more than 60 days overdue” or “tell me when stock of any part drops below 10.”
- Under When to send, choose Only when matches.
- Click + Add Condition and pick a column, an operator (equals, contains, greater than, between, on or before, and so on), and a value. Add more conditions with AND/OR as needed.
- Save the schedule.
Each time it fires:
- No matching rows — no email is sent; the schedule shows Skipped (no matches).
- Matching rows — an email goes out with [Alert] in the subject and the number of matches. The attachment has a Matches sheet with just the matching rows, alongside the full report.
Alert schedules show a bell Alert badge in the schedule list, and their latest results can be shown on a dashboard with the Alert Feed widget. Alerts aren’t available for pivot reports (they always send every run).
Creating the Schedule
Click Create Schedule. The schedule is now active and will send at the configured times.
Which company and what time? Report schedules run against the company that is active in Analytics for Spire when they fire, and their times are the Analytics for Spire server’s local time.
Managing Your Schedules
Your schedules appear on the Settings page under the “Scheduled Reports” section.
For each schedule, you can see:
- A green dot (active) or gray dot (paused).
- The schedule name and frequency.
- The recipient list.
- When it last ran and whether it succeeded or failed.
Available Actions:
| Action | Icon | What It Does |
|---|---|---|
| Edit schedule | Pencil icon | Change the name, frequency, recipients, or alert conditions |
| Pause / Resume | Play or Pause icon | Temporarily stop or restart the schedule |
| Run Now | Refresh icon | Send the report email immediately (asks for confirmation) |
| Delete | Trash icon | Permanently delete the schedule (asks for confirmation) |
What the Recipient Receives
Each scheduled email includes:
- Subject line: “Analytics for Spire Report: [Report Name] (YYYY-MM-DD)”
- Body: a brief message with the report name, date, and row count.
- Attachment: an Excel file (.xlsx) with the report data, formatted with currency, dates, frozen headers, and auto-fit columns.
The attachment contains the complete dataset for the report’s filters — not just the first page you see on screen — up to a cap of 50,000 rows. If a report hits the cap, the email says so explicitly so recipients know to narrow the filters.
If the report has date presets (like “YTD”), the dates are recalculated at the time the email is sent.
Missed runs catch up automatically. If the server was busy, paused (for example during a nightly backup snapshot), or briefly offline at the moment a schedule was due, the run is sent as soon as the server is healthy again — usually within a minute, for up to 6 hours after the missed time. Only the most recent missed run is recovered, so a server that was down for days sends one catch-up email per schedule, not a backlog.
21. Customer Statement Runs
Statement runs email every customer with an outstanding balance their own Customer Statement, on a schedule — using the contacts already set up in Spire. A typical setup is “on the 1st of every month, email a PDF statement to each customer’s Accounting contact.”
Requirements: An administrator must configure SMTP (email) settings first. Statement runs are managed on the Settings page.
Creating a Statement Run
- Go to Settings and find the Customer Statement Runs card.
- Click New Run. The New Statement Run dialog opens.
- Fill in the sections below and click Create Run.
Basics
- Name — defaults to “Monthly Customer Statements”.
- Company (Spire database) — whose customers and balances to use. The run always uses this company, no matter which company is active later.
- Frequency — Monthly (1st 8am), Weekly (Mon 8am), Daily at 8am, or Custom (enter a cron expression, as for scheduled reports).
Which customers
- Minimum Balance ($) — skip customers who owe less than this.
- Only customers with overdue items, optionally by at least a number of days.
- Respect Spire statement settings — only customers marked in Spire to receive statements by Email or Both.
- Active customers only and Skip customers on credit hold.
- Territories and Salespeople — leave empty for all.
- Never send to — a list of customer numbers to always exclude.
- Ignore items before — leave very old open items off the statements (same idea as on the aging reports).
- Skip customers with no account activity since their last statement.
Send to contact types Pick which Spire contact types receive the statement (for example Statements or Accounting). With no types selected, every contact with an email address receives it.
Statement content
- Open items only — or turn it off and set an Activity window (days) for a full transaction history.
- Attachment — PDF, EXCEL, or BOTH.
- Include aging summary — the Current / 1-30 / 31-60 / 61-90 / 90+ strip.
- Statement intro message and Statement footer / remit-to — optional text printed on every statement.
- Subject and Body — optional; a sensible default is provided. You can use merge fields:
{customer_name},{customer_no},{balance},{as_of_date},{company_name}. - Reply-To, CC, and BCC — optional.
Test mode and summary
- Send ALL statements to this address instead of customers — a test mode: the full run happens, but every email goes to you (marked [TEST]) instead of customers. Runs in test mode show a TEST MODE badge.
- Email a summary after each fire to — receive a summary listing who was sent a statement, who was skipped, and any errors.
Managing Statement Runs
Each run in the list shows its company, schedule, and the result of its last send (e.g. “sent 42, skipped 3”). The icons on each row:
| Icon | What It Does |
|---|---|
| Preview | Shows exactly which customers would receive a statement, with their balance and recipients — no emails are sent |
| Edit | Change the run’s settings |
| Pause / Resume | Temporarily stop or restart the run |
| Send statements now | Run it immediately |
| Send history | See every statement sent — when, to which customer, the balance, recipients, and status |
| Delete | Remove the run |
Tip: Always click Preview (or use test mode) before the first real run, so you know exactly who will receive a statement.
Branding Your Statements
Statement PDFs carry a letterhead with your logo, company name, and company address. An administrator sets these under Settings → Branding — once for all companies, or separately for each company if you have several (see Section 31).
22. Favorites
Star your most-used templates and saved reports for quick access.
How to Favorite
- On any template or saved report card, click the star icon.
- A filled (yellow) star means it is favorited. An outline star means it is not.
- Click again to remove from favorites.
Where Favorites Appear
- Dashboard — your favorite templates are shown in the right panel for one-click access.
- Templates page — click the “Favorites” filter button to show only your starred items.
23. Formulas (Calculated Columns)
Formulas let you create custom calculated columns that do not exist in the database.
Creating a Formula
- In the Report Builder, find the Formulas section (below the Sort section).
- Click + Add Formula.
- The Formula Editor opens.
Formula Editor Fields
- Column Name — the name that will appear as a column header (e.g. “Profit Margin”).
- Expression — the formula to calculate. Use
{table.column}to reference columns.- Example:
{sales_history.total} - {sales_history.cost} - Example:
{sales_history.total} / {sales_history.quantity}
- Example:
- Output Type — choose Number, Currency, String, or Date.
Available Functions
| Category | Functions |
|---|---|
| Math | ROUND, ABS, FLOOR, CEILING, GREATEST, LEAST |
| Text | CONCAT, UPPER, LOWER, TRIM, SUBSTRING, LEFT, RIGHT, REPLACE, LEN |
| Date | TODAY (today’s date), NOW (current date & time), YEAR, QUARTER, MONTH, WEEK, DAY, DOW (day of week), HOUR, EXTRACT, DATE_TRUNC (first day of the year / quarter / month / week), ADD_MONTHS (move a date forward or back by whole months) |
| Null Handling | COALESCE (use a fallback if value is empty), NULLIF |
| Conditional | CASE WHEN … THEN … ELSE … END |
| Comparisons | BETWEEN, IN, LIKE (each also with NOT) — usable inside CASE conditions |
Date Math and Examples
Dates subtract to whole days, which makes overdue-style calculations one-liners:
-
TODAY() - {ap_transactions.due_date}— days overdue (negative = not yet due). -
CASE WHEN TODAY() - {sales_history.invoice_date} > 30 THEN 'Overdue' ELSE 'OK' END -
MONTH({sales_history.invoice_date})— the month number (1–12); alsoYEAR(...),QUARTER(...), etc. -
CASE WHEN {sales_history.total} BETWEEN 100 AND 500 THEN 'Mid' ELSE 'Other' END -
CASE WHEN {customers.territory} IN ('West', 'North') THEN 'Region A' ELSE 'Region B' END -
CASE WHEN {customers.name} LIKE '%ltd%' THEN 'Ltd' ELSE '-' END— LIKE is case-insensitive, matching how filters behave. -
DATE_TRUNC('month', {sales_history.invoice_date})— the first day of the invoice’s month (also'year','quarter','week'). -
ADD_MONTHS({sales_history.invoice_date}, -12)— the same date one year earlier.
The SQL-standard spellings CURRENT_DATE and CURRENT_TIMESTAMP also work, and the parentheses on TODAY / NOW are optional.
Helpers
The Formula Editor has two helper panels:
- Column References — lists all available columns. Click one to insert its reference into your expression.
- Function Reference — lists all supported functions with examples. Click to insert.
Using Formulas
- Click Validate to check your expression for errors before saving.
- Click Save to add the formula to your report.
- Formula columns appear in the data grid after running the query.
- Formulas can be used in filters, sorting, and pivot values.
- Click the pencil icon next to a formula to edit it, or the trash icon to delete it.
Formulas belong to one report. If the same calculation is needed in many reports, ask your administrator to create it once as a Calculated Field instead (see below).
Calculated Fields (Shared Columns)
A calculated field is a formula defined once by an administrator under Settings → Calculated Fields (see Section 31). It then appears as an ordinary column of its table — with an fx badge — in every report, for every company. You can tick it in the sidebar, filter and sort on it, group by it, and drop it into any pivot zone, exactly like a real column.
Built-In Calculated Columns
Analytics for Spire ships with a few calculated fields already set up, for questions Spire’s tables don’t answer directly:
| Table | Column | What It Is |
|---|---|---|
| Inventory Statistics | Period Date | The first day of each statistics period’s month — a real date you can use with date presets. Always filter and pivot on Period Date, not Year End. Year End is the fiscal year-end date, so the current year’s rows carry a future date and “to today” presets (YTD, This Fiscal Year, Last 12/24 Months) silently leave the current year out. |
| Sales History | Invoice Month | The invoice date’s month number (1–12) |
| Sales History | Invoice Year | The invoice date’s year |
| Sales History Items | Line Sales | The line’s sales amount (unit price × shipped quantity, rounded to the cent). Sales History Items has no line-total column of its own; Line Sales adds up to the invoice subtotal. |
Comparing the same months across years. To see, for example, January–September sales by salesperson for each of the last few years: filter Invoice Month between 1 and 9, put Salesperson in the pivot’s Rows, Invoice Year in Columns, and the invoice total in Values.
24. Conditional Formatting
Highlight cells with colors based on rules you define.
How to Use Conditional Formatting
- After selecting columns (before or after running a query), click the Conditional Formatting button (palette icon) in the run bar area.
- The dialog opens showing your formatting rules.
Creating a Rule
- Click + Add Rule.
- Choose the Column to apply the rule to.
- Choose a Condition:
- Greater than / Less than / Equals / Not equals / Contains
- Between (enter a min and max value)
- Is empty / Is not empty
- Enter the Value for the condition.
- Choose a Color Preset:
| Color | Typical Use |
|---|---|
| Red | Negative values, overdue items, alerts |
| Green | Positive values, on-track items |
| Yellow | Warnings, items needing attention |
| Blue | Informational highlights |
| Orange | Important alerts |
- A preview shows how the formatted cell will look.
- Click Apply to save all rules.
Examples
- Revenue greater than 10,000 → Green highlight
- Status equals “Overdue” → Red highlight
- Quantity less than 50 → Yellow highlight
Formatting rules are saved with the report and apply each time you run it.
25. Publishable Dashboards (TV & Screen Dashboards)
Publishable Dashboards are multi-widget dashboards designed to be shared on a public URL — typically for office TVs, warehouse screens, or any shared monitor where staff can glance at live numbers without logging in. They are different from the Home Dashboard (see Section 5): the Home Dashboard is your personal landing page; Publishable Dashboards are named, designed by an editor, and can be published to a /k/<token> URL anyone with the link can view.
To open the dashboards area, click Dashboards in the top navigation.
Creating a Dashboard
- On the Dashboards list page, click New Dashboard.
- Give it a Name (e.g. “Sales Floor TV”) and an optional Description.
- Click Create. The dashboard opens in the Designer.
The theme, refresh interval, date slicer, and company binding are set afterwards in the Settings dialog (see below).
Each card on the list page has an Open button plus icons to Copy kiosk link, Open kiosk view, and Delete.
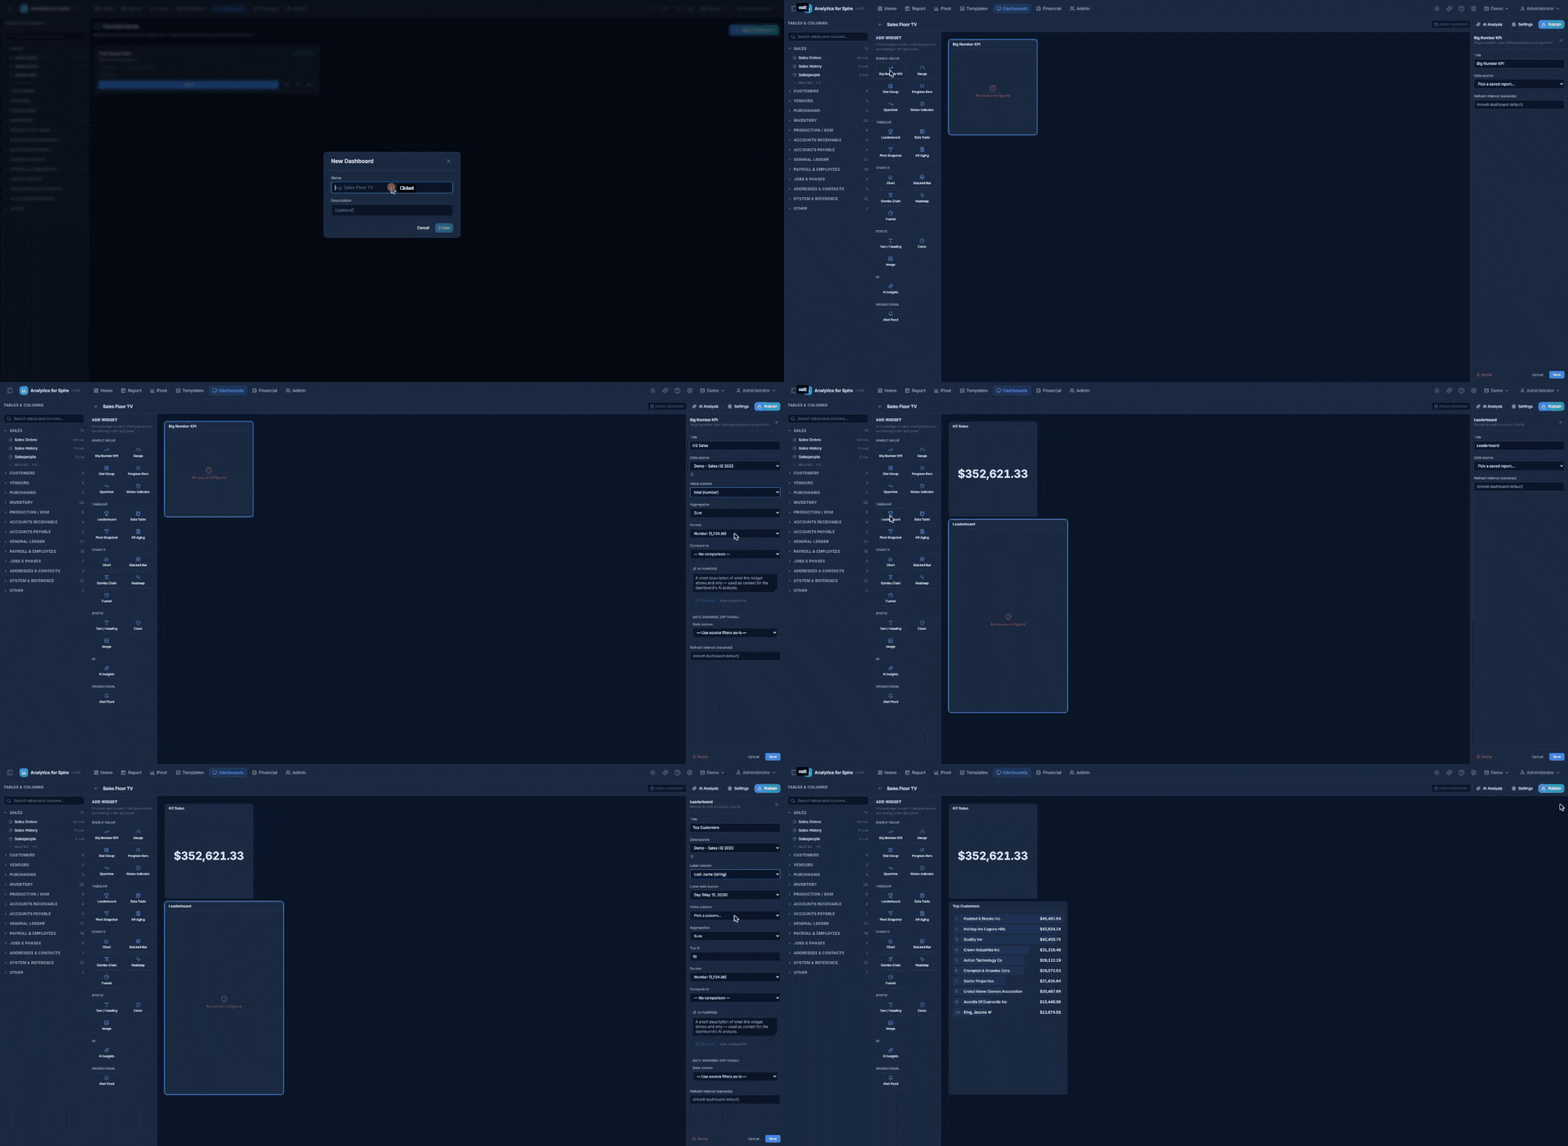
The Designer Layout
The Designer has three panes:
- Widget Palette (left) — every available widget grouped by category.
- Canvas (center) — a 12-column grid where you arrange widgets by dragging and resizing.
- Configuration Panel (right) — appears when you select a widget; configures source data and display options.
Above the canvas, a toolbar shows the date slicer (when enabled), the connection pill (see below), the kiosk link when published, the AI Analysis button (when AI is configured), Settings, and Publish / Unpublish.
Adding Widgets
Drag a widget from the palette onto the canvas, or click one to add it. There are 20 widget types:
Single value
- Big Number KPI — one headline value with optional comparison delta and sparkline.
- Gauge — % of target with color zones.
- Stat Group — 2–6 small KPIs in a strip.
- Progress Bars — several metrics with bars vs. target.
- Sparkline — a tiny trend chart with the current value.
- Status Indicator — a traffic light (OK / Warning / Critical) driven by thresholds.
Tabular
- Leaderboard — ranked Top N list with inline bars.
- Data Table — the top N rows of a saved report.
- Pivot Snapshot — a simple cross-tab of a saved report, including calculated values.
- AR Aging — outstanding receivables in 0-30 / 31-60 / 61-90 / 90+ day buckets.
Charts
- Chart — bar / line / pie / area.
- Stacked Bar — bars stacked by group.
- Combo Chart — bar + line on a shared X axis.
- Heatmap — a colored matrix (e.g. day × hour).
- Funnel — stage conversion.
Static
- Text / Heading — a label or formatted text block.
- Clock — live time and date.
- Image — a logo or other branding.
AI
- AI Insights — periodic AI commentary on the whole dashboard (see Section 26).
Operational
- Alert Feed — recent activity from your alert schedules (see Alert Feed below).
Binding a Widget to Data
Click a widget on the canvas to open its Configuration Panel. Every widget has an optional Title and Refresh interval (seconds) (leave blank to use the dashboard default). For data-driven widgets, you pick a saved report as the source — the widget runs that report’s query and shapes the result for its display.
Once a source is chosen, additional fields appear to bind the widget to specific columns:
- Big Number KPI — the value column and its aggregation (sum / avg / count / min / max).
- Leaderboard / Data Table — the label and value columns and the Top N limit. Leaderboards combine rows with the same label first, so a report with one row per invoice still shows each customer once.
- Chart widgets — X axis, Y axis, optional group-by, sort order, and — for date columns — grouping by Day / Week / Month / Quarter / Year.
- Heatmap — X dimension, Y dimension, and the cell value column.
- Status Indicator — a Direction (Higher is worse or Lower is worse), a Warning threshold (yellow) and Critical threshold (red), plus optional labels for each state.
Click Save in the panel to apply your changes.
Comparisons (vs. Previous Period)
The Big Number KPI, Stat Group, and Leaderboard widgets can show how the current number compares with an earlier period:
- Big Number KPI — set Compare to: Previous period (same-length window), Previous month, Previous quarter, or Previous year. Then choose a Display — Compact (big number plus a delta arrow, e.g. “+12% vs prior month”) or Split (current and previous side by side) — and a Direction: Higher is better or Lower is better, so the arrow is green when the change is good news.
- Stat Group — each stat has its own comparison dropdown (vs prior period / month / quarter / year).
- Leaderboard — set Compare to and each row shows a small Δ% next to its value. Rows that didn’t appear in the previous period show new.
Comparisons need a date range to shift: either a date-preset filter in the source report or a widget date override (below). If the comparison can’t be calculated, the current value still shows.
Widget Date Overrides
One saved report can power many widgets — an “MTD” KPI and a “YTD” leaderboard, for instance. Under Date override (optional) in a widget’s configuration:
- Date column — the date to filter on, or Use source filters as-is.
- Date preset — any preset, or Custom Range with a start and end date. A Resolves to: line shows the exact dates it means today.
Widgets with an override show a small calendar badge in the corner of the canvas, and they ignore the dashboard date slicer — clear the preset if you want the slicer to drive that widget.
Dashboard Date Slicer
The date slicer adds a single date-range picker that controls every widget at once — perfect for flipping a whole dashboard between This Month, This Quarter, and YTD.
- Open Settings and tick Enable dashboard date slicer.
- Set the Picker label (default “Date Range”) and the Default preset (default This Month).
- Click Save.
The picker appears in the Designer toolbar and in the top-right corner of the kiosk view. Every widget that uses a date preset switches to the slicer’s range; widgets with a date override stay on their own range. The kiosk view always starts on the default preset when it loads.
Drilling Into a Widget
Click a number, bar, slice, cell, or row on many widgets to see the rows behind it:
| Widget | Click |
|---|---|
| Big Number KPI | The value |
| Leaderboard | A row |
| Chart | A bar, point, or slice |
| Stacked Bar | A segment |
| Heatmap | A cell |
| AR Aging | A bucket — shows the invoices in it |
A window opens with the matching rows (up to 10,000) and a CSV button to download them. Press Esc to close it. Drilling works in the Designer and on the kiosk view.
Alert Feed
The Alert Feed widget lists your alert schedules (those set to Only when matches — see Section 20) with the latest result of each: N matched (yellow), No matches (green), Error (red), or Never fired, plus how long ago it ran. Set Max alerts (default 10) and Window (days) (default 7; leave blank for all time). It needs no data source.
Layout
Drag widgets around to reposition them. Drag the corner handle to resize. The grid is 12 columns wide; widget heights snap to consistent rows. Changes save automatically — no need to click Save.
Connection Binding
The toolbar shows a connection pill indicating which Spire database the dashboard queries:
- Active connection — the dashboard is unbound and queries whichever company is currently active.
- A company name — the dashboard is bound and always queries that company, regardless of which one is active.
The first time you publish an unbound dashboard, you’ll be asked to confirm binding it to the currently active company. This guarantees a kiosk TV in the lobby always shows that company’s numbers, even if the active company is switched later. You can re-bind from the Settings dialog.
Settings Dialog
Click Settings in the toolbar to open Dashboard Settings:
- Name and Description.
- Bound database connection — pick a company, or Use active connection (no binding).
- Kiosk theme — Dark (default), Light, or High contrast (TV). High contrast is intended for warehouse / shop-floor screens with bright overhead lighting.
- Default refresh interval (seconds) — how often widgets refresh on the kiosk view. Each widget can override it.
- Enable dashboard date slicer — see above.
- AI Analysis — see Section 26.
Who Can See a Dashboard
Dashboards don’t have an in-app sharing switch. To let other people see a dashboard, publish it to a kiosk link (below) and give them the link.
Publishing to a Kiosk URL
When you’re ready to put the dashboard on a TV or shared screen:
- Click Publish in the toolbar.
- The first publish asks you to confirm the connection binding (see above).
- After publishing, the toolbar shows the kiosk link:
/k/<long-random-token>. - Click Copy link to copy the full URL, or Open kiosk view to open it in a new tab.
The token is a long random string — only people you give the URL to can view the dashboard. Anyone with the URL can view it, no login required.
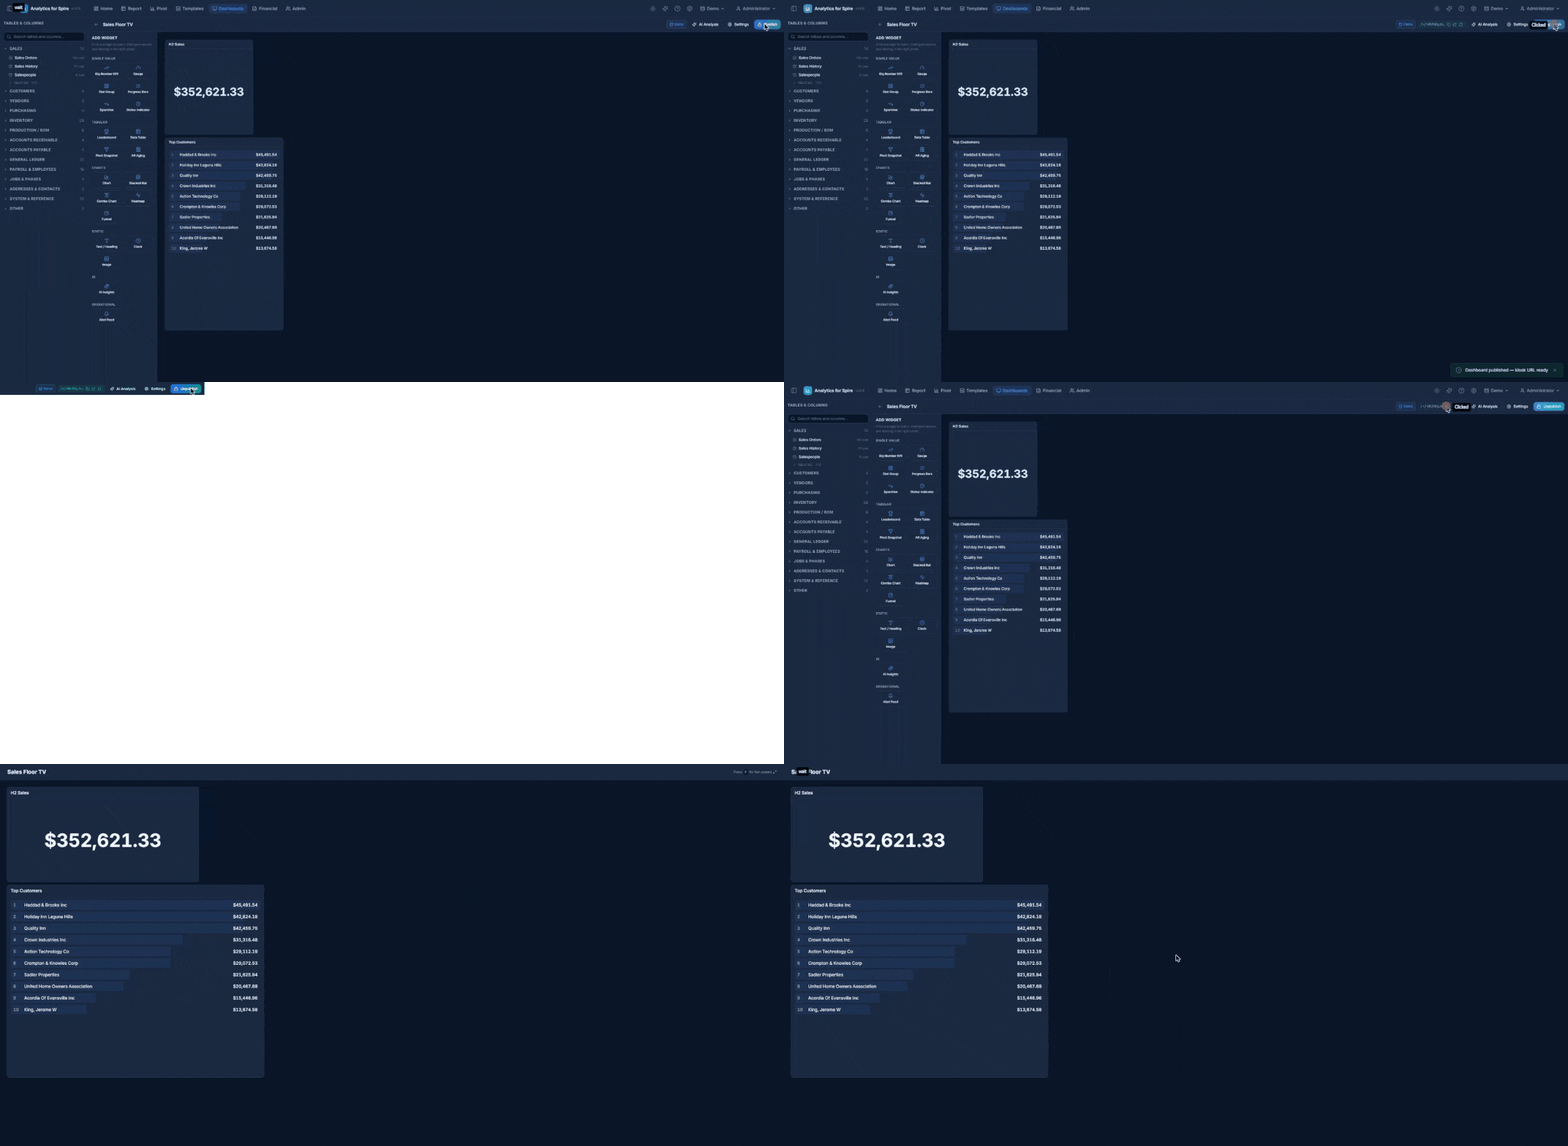
The Kiosk View
The kiosk URL (http://your-server/k/<token>) renders the dashboard full-screen with no app shell, sidebar, or header. Designed for TVs and large screens.
- F key — toggle full-screen.
- Themes — applied as set in the dashboard’s settings (dark / light / high contrast).
- Date slicer — shown in the top-right corner when enabled.
- Refresh — each widget refreshes on its own interval; the dashboard layout itself is re-checked every 5 minutes so changes in the Designer appear automatically without a page reload.
- Offline banner — an Offline indicator appears if the kiosk loses network connectivity. It clears automatically when the connection returns.
Rotating the Kiosk Token
If a URL has been shared with someone who shouldn’t have it any more (an employee left, a link leaked), click Rotate token on the kiosk link in the toolbar. This generates a new random token; the old URL stops working immediately. Anyone using the old URL will see “Dashboard unavailable.”
Unpublishing (clicking Unpublish) deactivates the URL without rotating the token. Republishing re-enables the same URL. To permanently invalidate a leaked URL, rotate the token.
26. AI Dashboard Analysis
Requires AI configuration: An administrator must have configured a Claude API key in Settings → AI Assistant before AI Analysis is available.
AI Dashboard Analysis runs Claude on your dashboard’s data on a schedule and produces a written summary — observations, anomalies, and highlights — which renders in the AI Insights widget. Use it to surface narrative context next to the numbers (“Sales are up 12% week-over-week, driven primarily by the Industrial division”).
Two related features are documented here:
- Dashboard-level AI analysis — scheduled, produces a paragraph or two of insight.
- Per-widget AI descriptions (“Discovery”) — short labels generated per widget on demand.
Enabling AI Analysis on a Dashboard
Open the dashboard’s Settings dialog (toolbar → Settings) and scroll to the AI Analysis section.
- Enable scheduled analysis — turn the scheduled run on or off.
- Schedule — pick a preset (e.g. Every hour · business hours · Mon–Fri, Every 30 min · business hours · Mon–Fri) or enter a custom cron expression.
- Timezone (IANA, blank = server local) — e.g.
America/Toronto, so the schedule fires at the right local time. - Daily token cap — a limit on total AI usage this dashboard may spend per day (UTC). Once hit, runs skip until midnight UTC. Default 100,000 tokens.
- Model — Haiku (fastest, cheapest), Sonnet (balanced, recommended), or Opus (highest quality, most expensive).
Click Save. The scheduler picks up the new cron automatically without a server restart.
Run Now (Admin Only)
The AI Analysis button in the toolbar opens the analysis modal. It shows the latest run (status, content, token usage, duration), the last 20 runs in a history list, and a Run Now button.
Run Now runs immediately, outside the schedule, but still respects the daily token cap. It is restricted to admins (other users see “Ask an admin to run the analysis.”) and limited to one manual run per dashboard per 60 seconds.
Reading the AI Analysis
The AI Insights widget renders the latest successful analysis. If no successful run has happened yet, the widget shows “No analysis available yet.” The output is a structured response with:
- Headline — short summary sentence.
- Bullets — observations and metrics.
- Concerns (optional) — anomalies or things worth investigating.
The widget refreshes on the dashboard’s regular interval; new analyses replace the old once they finish.
Per-Widget AI Description (“Discovery”)
Each widget can have an AI-generated one-line description explaining what it shows. Useful for kiosk audiences who didn’t design the dashboard.
To add one, select the widget on the canvas and click Generate in the AI Purpose box of the configuration panel. A short description (~1 sentence) is produced; you can edit it manually afterward, or click Regenerate.
The description renders below the widget’s title on the kiosk view (and in the designer preview).
Stale badge: If you later change the widget’s source or binding, the system notices the AI description was generated against a different configuration and shows a yellow Stale badge. Either regenerate or manually edit + save to clear the badge.
Token Usage and Cost
Each AI run logs its token cost. The AI Analysis modal shows the daily total, and admins can review the global daily total in Settings → AI Assistant. Costs are typically small per run; the bigger concern is runaway runs from misconfigured crons — the daily token cap is your safety net.
When Things Go Wrong
The history list surfaces failed runs with the error message — most commonly:
- No connection bound — old dashboards published before connection binding existed. Open Settings and pick a connection.
- API key invalid or quota exceeded — admin needs to update the key in Settings.
- Schema not loaded — typically transient; the next scheduled run will retry.
A run that fails for transient reasons doesn’t count against the token cap.
27. Light & Dark Mode
Analytics for Spire supports both a dark theme (default) and a light theme.
How to Switch
Click the sun / moon icon in the header.
- Sun icon — currently in dark mode; click to switch to light.
- Moon icon — currently in light mode; click to switch to dark.
Your choice is saved on your computer and remembered the next time you open Analytics for Spire. The theme applies everywhere — Reports, Pivots, Charts, Financial Reports, and the Admin pages.
28. Keyboard Shortcuts
Press Ctrl + / at any time to open the Keyboard Shortcuts help dialog.
| Shortcut | Action |
|---|---|
| Ctrl + Enter | Run the current query or pivot |
| Ctrl + S | Save your report or template |
| Ctrl + E | Open the Export dialog |
| Ctrl + Shift + R | Reset all configuration (clear everything) |
| Ctrl + Shift + A | Open / close the AI Assistant panel |
| Ctrl + / | Show this shortcuts help |
| F1 | Open this User Manual on the Help page |
29. Changing Your Password
- Click your name in the top-right corner of the header.
- Click Change Password.
- Enter your Current Password.
- Enter a New Password (minimum 8 characters).
- Enter the new password again in the Confirm New Password field.
- Click Change Password.
A success message confirms the change. You will continue to be signed in.
30. Administration (Admin Users Only)
If you have an Admin account, you will see an Admin tab in the header that opens the User Management page. Two more admin pages — Groups and Audit Log — are opened from your user menu (click your name in the top-right corner).
User Roles
Every user has one of three roles:
| Role | What They Can Do |
|---|---|
| Viewer | Read-only access to shared resources — they can open and run the reports, templates, and dashboards that have been shared with them. |
| Analyst (default) | Everything a Viewer can do, plus create and edit their own reports, templates, dashboards, and schedules. |
| Admin | Full access to everything, including user management, Settings, Groups, and the Audit Log. Admins bypass all permission checks. |
Upgrading from an earlier version? Users who had the old “User” role are now Analysts — nothing changes for them.
User List
A table showing every user with their Username, Display Name, Role (Admin, Analyst, or Viewer), Status (Active or Inactive), and Actions.
The action icons on each row are:
| Icon | Tooltip | What It Does |
|---|---|---|
| Shield | Table Permissions | Choose which database tables the user can see (non-admins only) |
| Gear | Feature Permissions | Turn individual features on or off for the user (non-admins only) |
| Database | Connection Access | Choose which companies the user can report on (non-admins only) |
| Pencil | Edit User | Change display name, role, or status |
| Key | Reset Password | Set a new temporary password |
| Trash | Deactivate User | Stop the user from signing in (not shown on your own row) |
Creating a New User
- Click Create User in the top-right corner.
- Fill in the fields:
- Username — the login name (cannot be changed later).
- Display Name — the user’s full name.
- Password — a temporary password (minimum 8 characters). The user must change it the first time they sign in.
- Role — Viewer, Analyst, or Admin (see User Roles above).
- Click Create User.
Access to Financial Reports, the AI Assistant, and other features is granted afterwards from the user’s row — see Feature Permissions below.
The Welcome Email
As soon as you create a user, a Welcome Email dialog appears with a ready-to-send message for them. It contains:
- Analytics address — the web address they should open to reach Analytics for Spire. You can edit it right in the dialog.
- A Subject line (with a copy button of its own).
- The Email text, which includes the sign-in address, their username, their temporary password, a reminder that they will be asked to choose a new password the first time they sign in, and a pointer to the ? Help button. You can edit the text before sending.
Then click one of the buttons:
- Copy email — copies the whole message to your clipboard so you can paste it into any email or chat program.
- Open in email app — starts a new message in your default email program with the subject and text already filled in.
- Done — closes the dialog.
The address comes from the App URL setting (see Section 31: Settings → App URL). If no App URL has been set, the address you are currently using in your browser is used instead. If that address is one other people can’t reach (for example http://localhost:3847 when you’re signed in on the server itself), the dialog warns you — edit the address in the dialog, or set the App URL in Settings so it’s always right.
Important: The password isn’t stored in readable form, so this dialog is the only time it is shown. Copy or send the email before clicking Done.
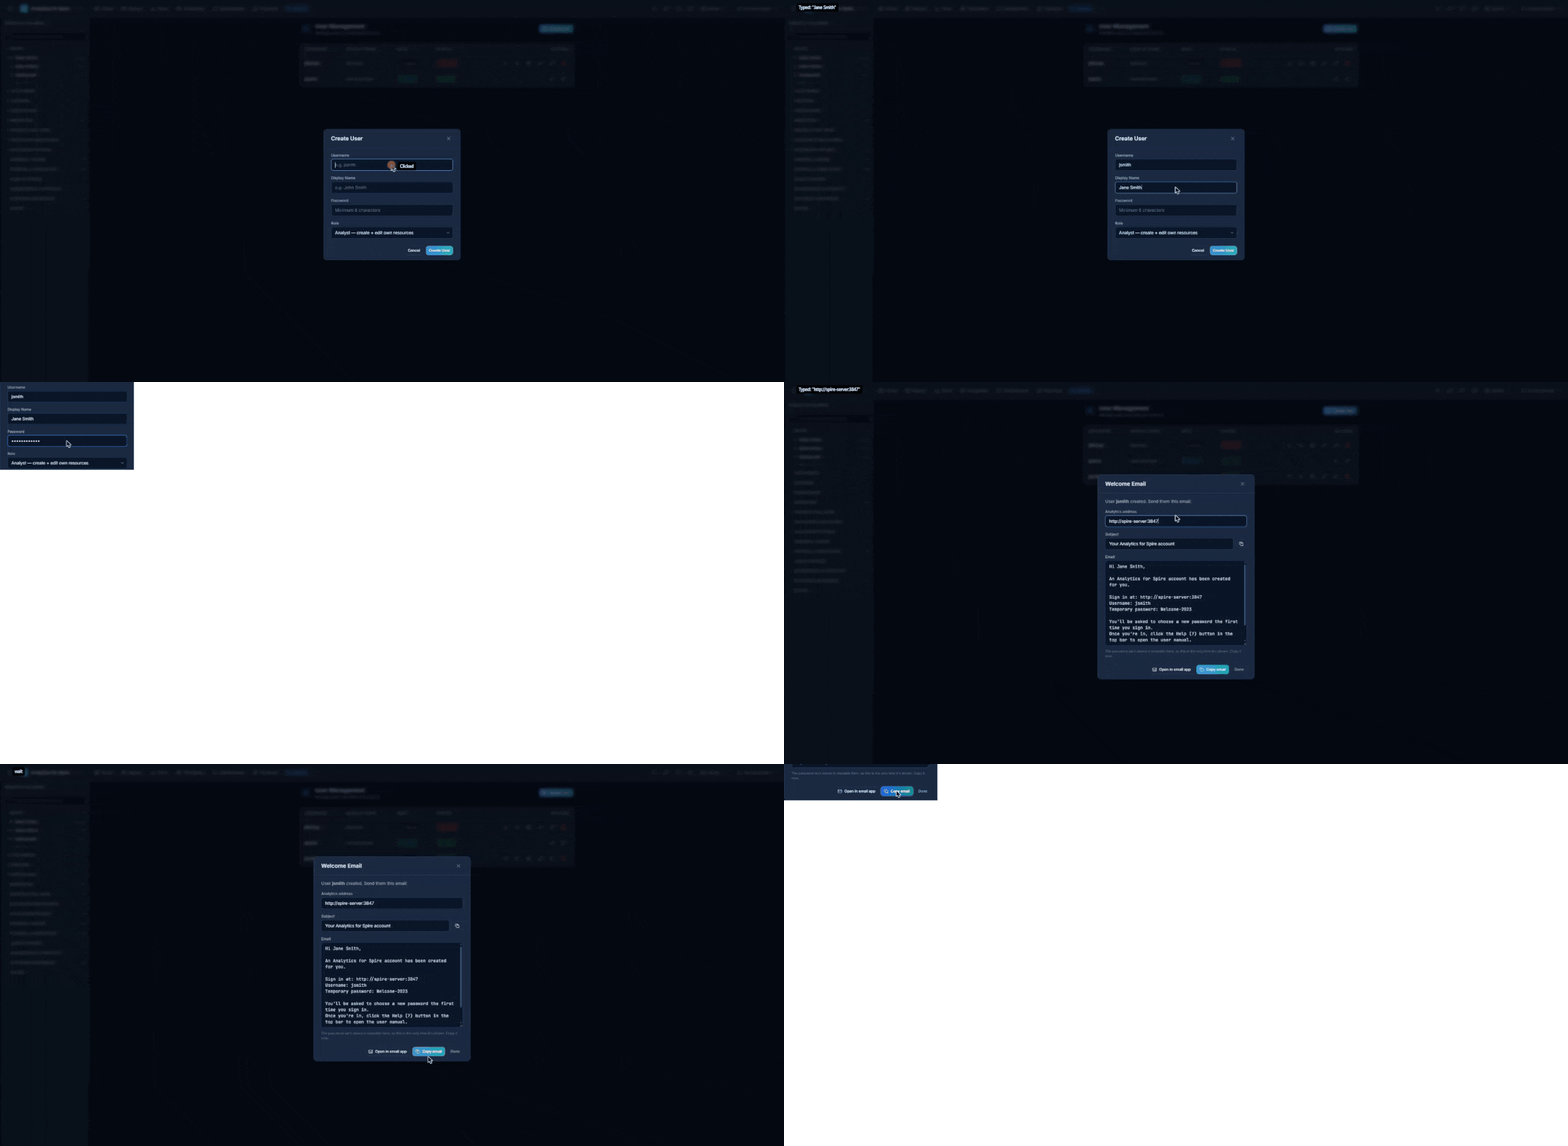
Editing a User
Click the pencil icon (Edit User) next to a user to change their display name, role, or Active status. Usernames cannot be changed.
Resetting a User’s Password
- Click the key icon (Reset Password) next to a user.
- Enter a New Password (minimum 8 characters).
- Click Reset Password.
A Password Reset Email dialog then appears — it works just like the Welcome Email, so you can send the user their new temporary password the same way. The user will be required to change this password on their next sign-in.
Setting Table Permissions
By default, non-admin users can access all tables. To restrict access:
- Click the shield icon (Table Permissions) next to a user.
- A checklist of all database tables appears, grouped by category. Each group has Select All and Deselect All links.
- Check the tables the user should have access to. Uncheck the ones they should not.
- Click Save Permissions.
The user will only see the permitted tables in their sidebar.
Feature Permissions
Click the gear icon (Feature Permissions) next to a user to turn individual features on for them:
| Feature | What It Allows |
|---|---|
| Financial Reports | View built-in and custom-formatted financial reports (the Financial tab and Format as Report) |
| AI Assistant | Use the natural-language report builder chat |
| Scheduled Reports | Create, edit, and run scheduled email reports |
| Publishable Dashboards | Create and manage publishable kiosk dashboards |
| View Connections | See the list of database connections in the picker |
| Manage Connections | Create / edit / delete Spire database connections |
Tick the features to grant and click Save. Admins automatically have every feature. Analysts can always see the connection list; anything else must be granted here.
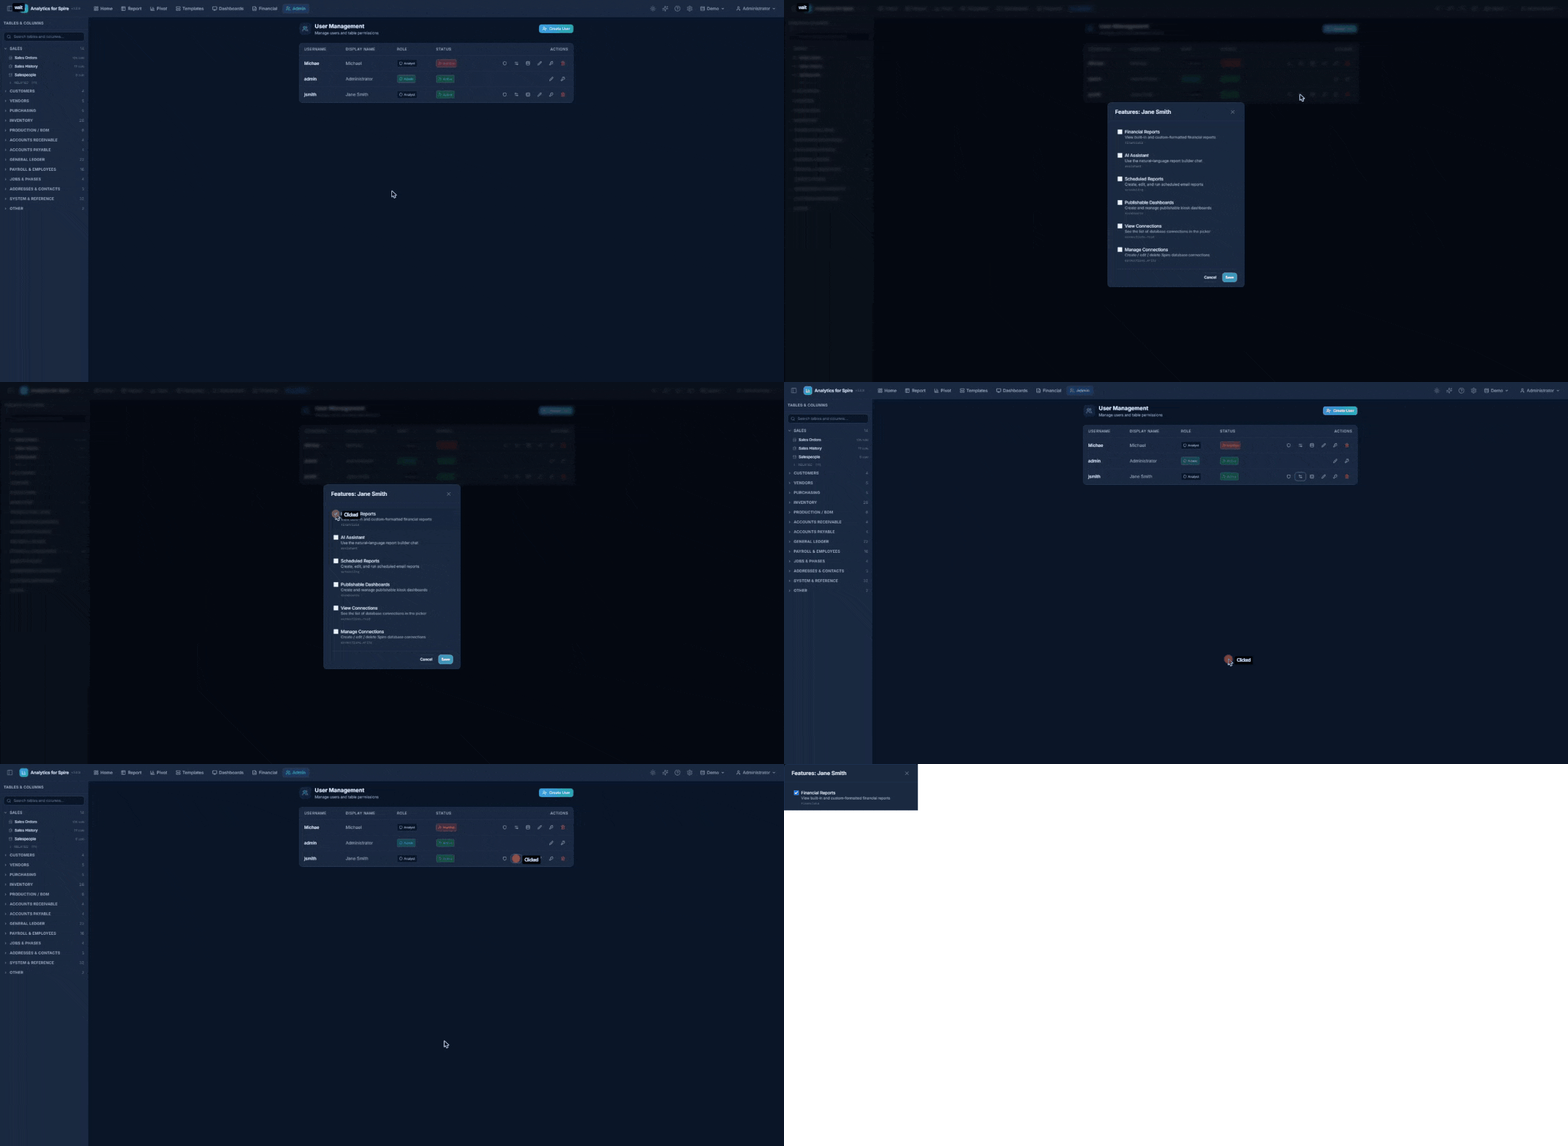
Connection (Company) Access
If you have more than one Spire company configured, you can limit which companies a user can report on:
- Click the database icon (Connection Access) next to a user.
- Tick the connections the user should be allowed to use.
- Click Save.
Leave every box unticked to give the user access to every connection (this is the default — the dialog shows Unrestricted — all connections visible). As soon as you tick one or more, the user is restricted to only those companies.
Groups
Groups are named sets of users — for example “Sales Team” or “Accounting” — that make it easier to manage who sees what.
- Click your name in the top-right corner and choose Groups.
- Click New Group, enter a Name and an optional Description, and click Save.
- Select the group in the list on the left. On the right, tick each user who should be a member — changes take effect immediately.
Note: In this version there is no option yet to share an individual report or template with just one group or one person — the Share with other users option in the Save dialog shares with everyone.
Hover over a group to Rename or Delete it. Deleting a group removes any sharing that was based on it; the reports, templates, and dashboards themselves are not affected.
Audit Log
The Audit Log is a permanent record of important actions — sign-ins (including failed attempts), sign-outs, user and group changes, template changes, connection changes, and permission grants.
- Click your name in the top-right corner and choose Audit Log.
- The log shows the Time, User, Action, Resource, details (Payload), and IP address of each entry, newest first, 50 per page. Use Previous / Next to page through.
- To narrow the list, fill in any of the filters and click Apply Filters:
- Action (prefix) — e.g.
user.for all user changes, ortemplate.delete. - Resource type — e.g.
template,dashboard. - User ID — leave blank for all users.
- Since (date) — only show entries from this date onward.
- Action (prefix) — e.g.
Entries cannot be edited or deleted, so the log is a reliable answer to “who changed this, and when?”
Deactivating a User
Click the trash icon (Deactivate User) next to a user and click Deactivate to confirm. Deactivated users cannot sign in but their data is preserved. To restore access, edit the user and tick Active again.
31. Settings (Admin Users Only)
The Settings page (gear icon in the header) is where administrators configure the license, database connections, the AI Assistant, calculated fields, branding, the app address, email delivery, and schedules. Other users can open Settings too, but the admin-only cards and buttons are hidden.
The cards appear in this order: License, Database Connections, AI Assistant, Calculated Fields, Branding, App URL, Email (SMTP) Settings, Scheduled Reports, and Customer Statement Runs.
License
This card shows your license status and when it was last verified. If you need to update or re-check your license, use the buttons on the card, or contact Gemini Logic.
Database Connections
This section lists every Spire database you have configured. Each entry shows the connection name, server, database, and username. The currently active connection is marked with an Active badge. A banner above shows Connected (with the active server and database) or Not Connected.
Adding a Connection
- Click Add Connection.
- Fill in:
- Name — a friendly label that appears in the database switcher (e.g. “ACME Canada”).
- Host — the server address.
- Port — the port number (default
5432). - Database Name — the database name.
- Username — the database login.
- Password — the database password.
- Test the connection to verify the credentials work.
- Click Save.
Editing or Deleting a Connection
- Click the pencil icon (Edit connection) to edit a connection. Leave Password blank to keep the saved one.
- Click the trash icon (Delete connection) to delete a connection. You cannot delete the connection that is currently active — switch to a different one first.
Fiscal Year Starts
When editing a connection, the Fiscal Year Starts dropdown controls which month that company’s fiscal year begins — used by the This Fiscal Year / Last Fiscal Year presets everywhere (reports, pivots, schedules, dashboards). The default, Auto-detect from gl_periods, reads it from the company’s Spire fiscal periods and shows the detected month. Pick a month (January–December) only if detection is wrong or the company has no fiscal periods set up; choosing Auto-detect again re-runs detection the next time you switch to that connection.
Switching Connections
Click the Switch to this connection icon next to a connection, or use the database icon dropdown in the header. Remember that switching changes the active company for everyone. See Section 7.
AI Assistant Settings
This section controls whether the AI Assistant is available to users.
Fields:
- API Key — your Anthropic API key (stored encrypted). You can obtain one at the Anthropic console.
- Model — choose the AI model:
- Haiku — fastest and cheapest, suitable for simple requests.
- Sonnet (default) — balanced quality and speed. Recommended for most users.
- Opus — highest quality, best for complex requests, slower and more expensive.
- Enable AI Assistant — turns the feature on or off across the whole application. When off, the sparkles icon does not appear in the header.
Test the key before saving to confirm the API key and model are valid. Non-admin users also need the AI Assistant feature permission (see Section 30).
Cost note: Each conversation with the Assistant uses your Anthropic API credit. Typical short requests cost a fraction of a cent; longer back-and-forth conversations cost more. You can monitor usage in your Anthropic console.
Calculated Fields
Calculated fields are reusable columns you define once and every user can then pick in the sidebar, for every company. Use them for calculations people need in many reports — gross profit, a margin, a cleaned-up code. (The built-in Period Date, Invoice Month, Invoice Year, and Line Sales columns are listed here too — see Section 23.)
- Click + Add Field.
- Fill in:
- Table — the table the column belongs to (can’t be changed later).
- Output type — number, currency, string, date, or boolean.
- Name (column key) — a short internal name, e.g.
gross_profit. - Label (optional) — the friendly name users see, e.g. Gross Profit.
- Expression — the formula, using
{table.column}references and the same operators and functions as report formulas (ROUND, COALESCE, NULLIF, CASE…END, date functions, and so on). Click the column chips to insert references.
- Click Validate to check the expression, then Create.
The field appears with an fx badge under its table in the sidebar. A calculated field works on one row of one table at a time — for totals or logic across several tables, ask Gemini Logic about a custom reporting view (these appear under Reports in the sidebar).
Branding
Branding sets the letterhead on emailed customer statement PDFs.
- Upload Logo (PNG or JPEG) — use Replace Logo or Remove to change it.
- Company name and Company address (one line per row; shown under the name on statement PDFs).
- Click Save Company Info.
If you have more than one company, a Scope dropdown appears: choose Global default (all companies) to set the default, or pick a company to override its logo, name, and address. A company with no override uses the global values (“Showing the global logo — upload here to override for this company.”).
App URL
The App URL is the address people type to reach Analytics for Spire from their own computers — for example http://spire-server:3847. It’s used in the Welcome Email shown after you create a user or reset a password (see Section 30). Enter it and click Save. Leave it blank to use whatever address is in your browser at the time — which is fine as long as you aren’t signed in on the server itself as localhost.
Email (SMTP) Settings
This section configures email delivery for scheduled reports, alerts, and statement runs.
Fields:
- SMTP Host — your email server (e.g.
smtp.gmail.com,smtp.office365.com). - Port — the SMTP port (
587for TLS is most common,465for SSL). - Username — the email account username.
- Password — the email account password (stored encrypted).
- From Address — the “from” email address recipients will see (e.g.
reports@yourcompany.com). - Use SSL/TLS — check this box for secure email delivery (recommended).
Buttons:
- Test Connection — verifies the SMTP settings without saving.
- Save SMTP Settings — saves the configuration so scheduled reports can send emails.
Scheduled Reports
A list of all active and paused report schedules. See Section 20: Scheduled Email Reports for details on managing them.
Customer Statement Runs
Scheduled customer statement emails. See Section 21: Customer Statement Runs.
32. Creating a Read-Only Database User (Recommended)
For maximum security, we recommend creating a dedicated database user that can only read data from your Spire database. This ensures Analytics for Spire can never modify, delete, or add any data to Spire — even if something unexpected happens.
Who should do this? Your IT administrator or whoever manages your PostgreSQL / Spire database server. Your Gemini Logic consultant can also set this up for you during installation.
Why This Matters
Analytics for Spire already has multiple built-in safeguards that prevent any changes to your data. However, creating a read-only database user adds one more layer of protection at the database level itself — this is industry best practice for any reporting tool.
Step-by-Step Instructions
Option A: Using pgAdmin (Graphical Interface)
pgAdmin is the most common tool for managing PostgreSQL databases. If your IT team uses it:
-
Open pgAdmin and connect to your Spire database server.
-
Create a new user (role):
- In the left panel, expand your server, then right-click Login/Group Roles and select Create → Login/Group Role.
- On the General tab, enter a name:
analytics_ro - On the Definition tab, enter a strong password and note it down.
- On the Privileges tab, make sure Can login is set to Yes. Leave everything else as No.
- Click Save.
-
Grant read-only access to your Spire database:
- In the left panel, right-click your Spire database and select Query Tool.
- Copy and paste the following commands, then click the Run button (play icon):
-- Grant the ability to connect
GRANT CONNECT ON DATABASE your_database_name TO analytics_ro;

-- Grant read-only access to all tables in the public schema
GRANT USAGE ON SCHEMA public TO analytics_ro;
GRANT SELECT ON ALL TABLES IN SCHEMA public TO analytics_ro;

-- Grant read-only access to the v3 schema (if it exists)
GRANT USAGE ON SCHEMA v3 TO analytics_ro;
GRANT SELECT ON ALL TABLES IN SCHEMA v3 TO analytics_ro;

-- Grant read-only access to the matviews schema (if it exists)
GRANT USAGE ON SCHEMA matviews TO analytics_ro;
GRANT SELECT ON ALL TABLES IN SCHEMA matviews TO analytics_ro;

-- Automatically grant read-only access to any future tables
ALTER DEFAULT PRIVILEGES IN SCHEMA public GRANT SELECT ON TABLES TO analytics_ro;
ALTER DEFAULT PRIVILEGES IN SCHEMA v3 GRANT SELECT ON TABLES TO analytics_ro;
ALTER DEFAULT PRIVILEGES IN SCHEMA matviews GRANT SELECT ON TABLES TO analytics_ro;
Important: Replace
your_database_namewith the actual name of your Spire database (e.g.spire_live). If you get an error about a schema not existing, that’s OK — just remove that line and run the rest.
-
Update Analytics for Spire to use the new user:
- Log in to Analytics for Spire as an admin.
- Go to Settings (gear icon).
- Edit your Database Connection — change the Username to
analytics_roand enter the password you created. - Click Test Connection to verify it works.
- Click Save.
-
Verify it works: Go to the Report Builder, select a table, and run a query. If data comes back, you’re all set.
Option B: Using the Command Line (psql)
If your IT team prefers the command line:
-
Connect to the database server using psql:
psql -h your_server -U postgres -d your_database_name -
Run these commands:
-- Create the read-only user CREATE ROLE analytics_ro WITH LOGIN PASSWORD 'your_secure_password'; -- Grant read-only access GRANT CONNECT ON DATABASE your_database_name TO analytics_ro; GRANT USAGE ON SCHEMA public TO analytics_ro; GRANT SELECT ON ALL TABLES IN SCHEMA public TO analytics_ro; GRANT USAGE ON SCHEMA v3 TO analytics_ro; GRANT SELECT ON ALL TABLES IN SCHEMA v3 TO analytics_ro; GRANT USAGE ON SCHEMA matviews TO analytics_ro; GRANT SELECT ON ALL TABLES IN SCHEMA matviews TO analytics_ro; -- Auto-grant for future tables ALTER DEFAULT PRIVILEGES IN SCHEMA public GRANT SELECT ON TABLES TO analytics_ro; ALTER DEFAULT PRIVILEGES IN SCHEMA v3 GRANT SELECT ON TABLES TO analytics_ro; ALTER DEFAULT PRIVILEGES IN SCHEMA matviews GRANT SELECT ON TABLES TO analytics_ro; -
Update the connection in Analytics for Spire Settings as described in step 4 above.
What If Something Goes Wrong?
- “Permission denied for table…” — this means the GRANT commands didn’t cover all schemas. Run the GRANT commands again for the missing schema, or ask your IT administrator for help.
- “Password authentication failed” — double-check the password you set matches what you entered in Analytics for Spire Settings.
- “Cannot connect” — make sure the Analytics for Spire server can reach the database server on the network.
Summary
| Layer | Protection |
|---|---|
| Database user (this section) | PostgreSQL itself blocks any write attempts |
| Session setting | Each query runs in read-only transaction mode |
| Application checks | Analytics for Spire rejects write commands before they reach the database |
All three layers work independently. Even if one were bypassed, the others would still prevent any changes to your Spire data.
33. Troubleshooting & FAQ
“Not Connected” — I cannot see any tables
Cause: The database connection is not configured or has failed.
Solution:
- Go to Settings (gear icon in the header).
- Edit your Database Connection and verify the Host, Port, Database, Username, and Password.
- Click Test Connection to verify.
- If the test passes, click Save and Set Active.
- The sidebar should now show your tables.
My tables changed when I switched companies
Cause: Each company has its own set of tables in its own database. Switching connections shows the tables of the newly selected database.
Solution: This is expected. Re-select tables from the sidebar to build your report against the new company’s data. Saved reports and templates remain available regardless of which connection is active, but they may show errors if a referenced table doesn’t exist in the active database.
My query is running slowly
Possible solutions:
- Add filters to reduce the amount of data returned (e.g. filter by date range).
- Remove columns you do not need.
- For very large datasets, pivot tables may be faster than viewing all rows.
- Turn off Live Preview if you are doing a lot of small edits — this prevents the background queries from running between each change.
Live Preview keeps re-running while I’m typing
Solution: Turn off the Live Preview toggle near the Run Query button while you set things up, then turn it back on (or click Run Query) when you’re ready to see results.
I cannot edit or delete a template
Cause: System templates (indicated by a lock icon) are read-only and cannot be modified or deleted.
Solution: Click the Duplicate button (copy icon) to create your own copy, then edit or delete your copy.
The AI Assistant icon (sparkles) is missing
Cause: The AI Assistant has not been enabled by your administrator, or the API key is invalid.
Solution: Ask your administrator to go to Settings → AI Assistant and verify the API key and that the Enable AI Assistant toggle is on.
The AI Assistant gives wrong tables or columns
Solution: The Assistant works from the database structure, but it can occasionally pick the wrong table for a request. After clicking Apply, review the configuration in the Report Builder and adjust as needed. You can also rephrase your question — for example, instead of “show me sales”, try “show invoices from sales_history grouped by customer”.
I cannot see the Financial tab
Cause: Financial Reports are restricted to administrators and to users who have been granted the “Financial Reports” permission.
Solution: Ask your administrator to open Admin → Feature Permissions on your user account and tick Financial Reports.
I forgot my password
Solution: Ask an administrator to reset your password from the Admin page. They can send you the new temporary password with the Welcome email, and you will be asked to create a new password on your next sign-in.
My scheduled report failed
- Go to Settings and look at the Scheduled Reports section.
- Check the last status and error message next to your schedule.
- Common causes:
- SMTP is not configured — ask your admin to set it up.
- Invalid email address — edit the schedule to correct the recipient.
- Database connection lost — the report query could not run.
- After fixing the issue, click the Run Now button (refresh icon) to test it.
A scheduled report didn’t run last night
Cause: Schedules only fire while the Analytics for Spire server is running. Short interruptions are covered — a missed run is sent as soon as the server is back, for up to 6 hours. If the server was down longer than that (or stopped and didn’t restart), the run is skipped.
Solution: Check the schedule’s last status on the Settings page. If it says Skipped (no matches), it’s an alert schedule and nothing matched — that’s expected. Otherwise, ask your IT administrator (or your Gemini Logic consultant) to make sure the Analytics for Spire service stays running. You can always click Run Now to send the report manually.
My LEFT JOIN report is missing rows after I added a filter
Cause: A filter on the joined table removes the rows that have no match there — so “all items, with their sales in the last 24 months” loses every item with no sales.
Solution: Click the In join pill on that condition so it’s applied inside the join instead. See Keeping Unmatched Rows (“In join”).
My Inventory Statistics report shows nothing for this year (or YTD is empty)
Cause: The report is filtered on Year End, which is the fiscal year-end date — for the current year it’s in the future, so “to today” presets leave it out.
Solution: Filter (and pivot) on the built-in Period Date column instead. See Built-In Calculated Columns.
A new user can’t open the address in their welcome email
Cause: The email used the address in your browser, which was a local address such as localhost that only works on the server itself.
Solution: Set Settings → App URL to the address people use from their own computers (e.g. http://spire-server:3847), then reset the user’s password to get a fresh Password Reset Email with the right address.
I can’t switch companies
Cause: Switching the active company affects everyone, so only administrators can do it — and your administrator may have limited which companies you can see.
Solution: Ask an administrator to switch, or use the Companies section in the Report Builder to include other companies in a cross-company report.
My exported Excel file does not open
Possible solutions:
- Make sure you have Microsoft Excel, LibreOffice Calc, or Google Sheets installed.
- Try downloading the file again (it may have been corrupted during download).
- Try exporting as CSV instead.
My financial report shows inflated totals (multi-currency)
Cause: In multi-currency Spire databases, accounts have one row per currency. If a report isn’t filtered correctly, transactions can be counted multiple times.
Solution: All built-in financial reports automatically filter to the base currency unless you pick a specific currency. If you have built a custom report and see inflated totals, make sure your currency filter is set, or ask your administrator to review the report definition.
I do not see the Admin tab
Cause: The Admin tab (and the Groups and Audit Log menu items) are only visible to users with the Admin role.
Solution: Contact your administrator if you need admin access.
Pivot table shows “No data”
Possible causes:
- Your filters may be too restrictive — try removing some. Check both the report filters and any Filters-zone chips on the pivot (click a chip to see its condition).
- A Value Filter may be hiding every row — check the Value Filters bar below the drop zones and remove or loosen it.
- The Values zone is empty — you must drag at least one numeric field there.
- The Rows zone is empty — you must drag at least one field there.
My kiosk dashboard shows “Dashboard unavailable”
Possible causes:
- The dashboard was unpublished — open it in the designer and click Publish again.
- The token was rotated — the old URL is now invalid. The dashboard owner needs to share the new URL (shown in the toolbar after publishing).
- The Analytics for Spire server is unreachable from the TV — confirm the URL host/port and that the TV is on the same network.
My kiosk dashboard shows the wrong company
The dashboard is bound to the wrong connection. Open the dashboard in the designer → Settings → re-bind the Connection dropdown to the right company → Save. The kiosk view refreshes automatically within five minutes (or instantly on reload).
AI Analysis isn’t running on my dashboard
Possible causes:
- AI Assistant isn’t configured — ask an admin to add a Claude API key in Settings → AI Assistant.
- The dashboard isn’t bound to a connection. Open Settings → pick a Connection → Save.
- The schedule only fires at certain hours/days (e.g. business hours, Mon–Fri) — check the Schedule and Timezone settings.
- The daily token cap has been hit. Wait for midnight UTC or raise the Daily token cap in dashboard Settings.
- Check the AI Analysis modal’s history list — failed runs show the error message there.
34. Quick Reference
Building a Report — Summary
- Select tables and columns in the sidebar — either by expanding a table, or by typing a field name in the search box and clicking results under the Columns section to add them in one click.
- (Optional) Adjust joins if using multiple tables.
- (Optional) Add filters to narrow results — use Add Group for AND/OR mixes and In join to keep unmatched rows on a LEFT JOIN.
- (Optional) Add sorting to order results.
- Click Run Query (or press Ctrl + Enter).
- Review results in the data grid.
- (Optional) Group, sort, or reorder columns by dragging.
- (Optional) Export to Excel or CSV.
- (Optional) Save as a report or template.
Building a Pivot Table — Summary
- Select tables and columns in the sidebar.
- Click the Pivot tab.
- Drag fields to Rows, Columns, Values, and Filters zones.
- Set conditions on Filters-zone chips (the editor opens on drop; click a chip to change it).
- Choose aggregation functions (SUM, AVG, COUNT, MIN, MAX) for value fields.
- Optionally add Value Filters to hide result rows by their totals (e.g. Row Total ≠ 0), Calculated values (e.g.
{Revenue} / {Invoice Count}), or turn on Compare Periods. - Click Run Pivot (or press Ctrl + Enter).
- Click any cell to drill down into detail rows.
Generating a Financial Report — Summary
- Click the Financial tab.
- Pick a built-in report or a custom report.
- Fill in the parameters (date range, division, currency, etc.).
- Click Generate.
- Print or export the formatted report.
Asking the AI Assistant — Summary
- Click the sparkles icon (or press Ctrl + Shift + A).
- Type your question in plain English.
- When the Assistant proposes a configuration, click Apply to load it.
- Run, save, or schedule the report as normal.
Publishing a Dashboard to a TV — Summary
- Open Dashboards in the top nav. Click New Dashboard.
- Name it and click Create. Pick a Kiosk theme (Dark / Light / High contrast) under Settings.
- Drag widgets from the palette onto the canvas. For each widget, pick its source (a saved report) and bind it to the right columns / aggregation.
- Drag and resize widgets until the layout looks right. Layout saves automatically.
- (Optional) In Settings, tick Enable dashboard date slicer so viewers can change the date range.
- Click Publish in the toolbar. Confirm the connection binding.
- Copy the kiosk link (Copy link in the toolbar) and open it on the TV / shared screen. Press F to enter full-screen.
Enabling AI Analysis on a Dashboard — Summary
- Open the dashboard in the Designer. Click Settings in the toolbar.
- Scroll to the AI Analysis section and tick Enable scheduled analysis.
- Pick a schedule preset (or custom cron) and set the timezone.
- Pick a model (Sonnet is a good default) and a daily token cap.
- Save. The first scheduled run will populate the AI Insights widget; or click AI Analysis → Run Now in the toolbar for an immediate result.
Keyboard Shortcuts
| Shortcut | Action |
|---|---|
| Ctrl + Enter | Run query / Run pivot |
| Ctrl + S | Save |
| Ctrl + E | Export |
| Ctrl + Shift + R | Reset |
| Ctrl + Shift + A | Toggle AI Assistant |
| Ctrl + / | Shortcuts help |
| F1 | Open the User Manual (Help page) |
Date Preset Quick Reference
| Preset | Range |
|---|---|
| Today | Today |
| Yesterday | Yesterday |
| This Week | Mon – Today |
| Last Week | Last Mon – Last Sun |
| This Month | 1st – Today |
| Last Month | Previous full month |
| This Quarter | Quarter start – Today |
| Last Quarter | Previous full quarter |
| YTD | Jan 1 – Today |
| Last Year | Previous Jan 1 – Dec 31 |
| Last 7/30/90 Days | Rolling window from today |
| Last 12 Months | 1 year ago – Today |
| Last 24 Months | 2 years ago – Today |
| This / Last Fiscal Year | Based on the company’s fiscal year |
| Last Hour / 4 / 8 / 12 / 24 Hours | Rolling window (date-and-time columns only) |
35. Write-Back to Spire
Write-Back calculates a value for each inventory item or customer and saves it into Spire, so buyers and salespeople see it right in Spire. Typical uses:
- Reorder points from real sales velocity and lead time
- ABC classification in an inventory UDF
- Fast / Slow / Dead stock labels, turns and days of supply
- Predicted next purchase date and an at-risk flag on customers
- Cost-plus sell prices for a price level
Nothing is written until an administrator reviews the changes and approves them, and every write can be undone.
Write-Back changes data in Spire. Writes go through the official Spire API, so Spire’s own rules apply and each change shows the Spire user it was made under.
Before You Start: Connect the Spire API
Reports read Spire’s database directly, but writing needs the Spire API.
- In Spire, create a user for Analytics, for example with initials SAA. Changes made by Write-Back are then easy to spot in Spire.
- In Analytics, go to Settings → Connections, click Edit on the company, and open Spire API (for write-back).
- Enter the Spire Server URL, for example
https://spire-server:10880. Spire Cloud URLs have no port. - Click List companies on this server and pick the company.
- Enter the Spire username and password.
- Click Test Spire API, then Save Spire API.
Leave Allow the Spire server’s self-signed certificate ticked for an on-premise Spire server.
Who Can Use It
- Administrators can create rules, compute runs, write to Spire and revert.
- Other users need the Write-Back feature, granted under Admin → Feature Permissions. They can view rules and compute runs, but only an administrator can write to Spire.
Open it from the user menu (top right): Write-Back to Spire.
Creating a Rule
Click New rule. A rule has three parts.
1. Calculation: pick a recipe and adjust its settings.
| Recipe | What it calculates |
|---|---|
| Reorder point | Average daily demand × lead time + safety stock. Safety stock = Z (service level) × daily demand variability × √lead time. Lead time comes from PO history (order date to receipt) or a fixed number of days. |
| ABC classification | Ranks items by revenue, gross profit or units. Items making up the top 80% are A, the next 15% are B, the rest are C, and items with no sales are D. All thresholds and labels can be changed. |
| Inventory performance | Turns (annual cost of goods sold ÷ stock value), days of supply, days since the last sale, and a Fast / Normal / Slow / Dead label. |
| Customer purchase cadence | From each customer’s invoice dates it works out the average gap between purchases, the variation in that gap, the predicted next purchase (last purchase + average gap), and at risk (late by more than the chosen number of standard deviations). |
| Cost-plus sell price | Price = cost ÷ (1 − margin) or cost × (1 + markup), using current, average or standard cost. Rounding options include .99. Prices below cost are blocked. |
| Custom | Uses any saved report. Pick the key column (part number or customer number) and either a value column or a formula such as {Unit Price} * 1.05. |
Measure up to is normally Today. For a test or archive company whose sales stop in the past, use Latest invoice date in Spire.
2. What to write, and where: pick which result to write and the Spire field it goes to. This can be:
- an inventory field (Reorder Point, Minimum Buy Qty)
- an inventory or customer UDF
- for the price recipe, a price level and unit of measure
Customer UDFs are listed with where Spire keeps them: on the billing address or on the customer record.
Drop-down UDFs: if the UDF only allows certain values, the value written must be one of them. For example, an “At Risk” drop-down with Yes / No needs the recipe’s labels set to Yes and No. Values that don’t match are blocked in the review.
To add a new UDF (for example ABC Class), create it in Spire first. It then appears in the list.
3. Safety and schedule
- Flag changes larger than (%): big jumps are flagged for a closer look.
- Flag values below / above: catches values outside a sensible range.
- Schedule: compute a new run daily, weekly or monthly. Scheduled runs wait for review unless Auto-apply is ticked.
- Auto-apply writes only unflagged changes. Leave it off until you trust the rule.
- Email when a scheduled run is ready: needs SMTP settings.
Click Preview at any time to see the first 50 changes without saving anything.
Reviewing and Writing a Run
- Select the rule and click Compute new run. This calculates every value but writes nothing.
- The review table shows each record’s Current and Proposed value and the change. Click the arrow on a row to see the numbers behind it (demand, lead time, invoice gaps and so on).
- Use the filters (Changed, Flagged, Conflicts & errors, Written, All) and the search box to focus. Excel downloads the whole run.
- Tick the rows you want and click Write selected to Spire, or Write all unflagged.
Before each record is written, Analytics re-reads it from Spire. If someone changed it after the run was computed, the record is skipped and marked conflict. Compute a new run to pick up the latest values.
Undoing a Run
Click Revert on a written run to put back the values each record had before. Records changed in Spire since the write are skipped and reported, so they’re never overwritten.
Tips
- Start with a small scope (one warehouse or product code) and check a few records in Spire before writing everything.
- Blocked rows (shown in red) can’t be written. Typical causes are a price below cost or a value that isn’t in a drop-down’s list.
- Deleting a rule doesn’t change values already written to Spire.
Analytics for Spire is developed by Gemini Logic Inc. For support, contact your system administrator or Gemini Logic.